Immigrants from Yemen vs Immigrants from El Salvador No Schooling Completed
COMPARE
Immigrants from Yemen
Immigrants from El Salvador
No Schooling Completed
No Schooling Completed Comparison
Immigrants from Yemen
Immigrants from El Salvador
4.1%
NO SCHOOLING COMPLETED
0.0/ 100
METRIC RATING
346th/ 347
METRIC RANK
3.9%
NO SCHOOLING COMPLETED
0.0/ 100
METRIC RATING
345th/ 347
METRIC RANK
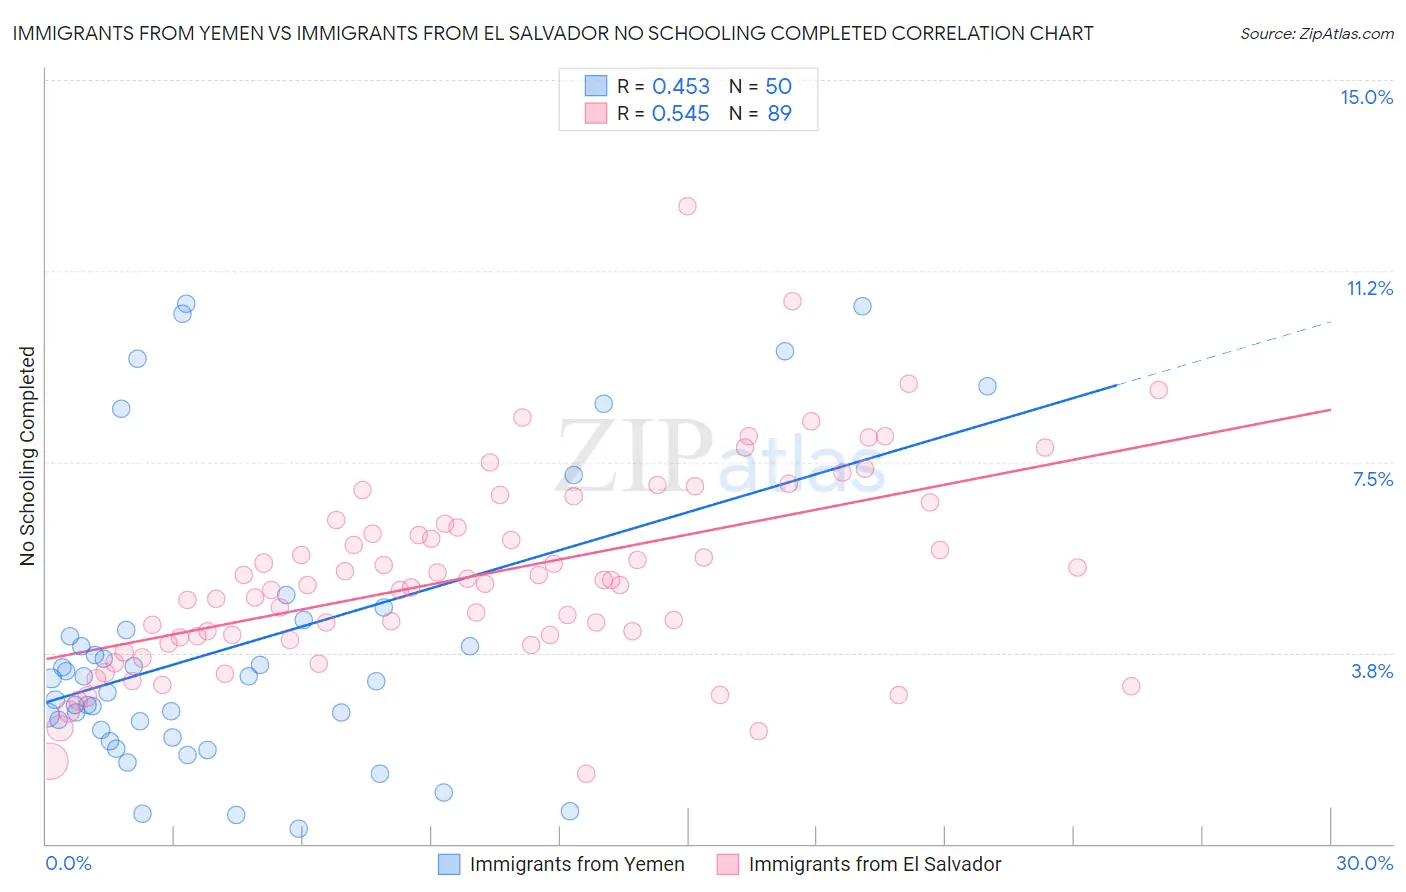
Immigrants from Yemen vs Immigrants from El Salvador No Schooling Completed Correlation Chart
The statistical analysis conducted on geographies consisting of 82,409,118 people shows a moderate positive correlation between the proportion of Immigrants from Yemen and percentage of population with no schooling in the United States with a correlation coefficient (R) of 0.453 and weighted average of 4.1%. Similarly, the statistical analysis conducted on geographies consisting of 355,993,592 people shows a substantial positive correlation between the proportion of Immigrants from El Salvador and percentage of population with no schooling in the United States with a correlation coefficient (R) of 0.545 and weighted average of 3.9%, a difference of 6.4%.
No Schooling Completed Correlation Summary
| Measurement | Immigrants from Yemen | Immigrants from El Salvador |
| Minimum | 0.30% | 1.4% |
| Maximum | 10.6% | 12.5% |
| Range | 10.3% | 11.1% |
| Mean | 3.9% | 5.3% |
| Median | 3.2% | 5.1% |
| Interquartile 25% (IQ1) | 2.2% | 4.0% |
| Interquartile 75% (IQ3) | 4.2% | 6.3% |
| Interquartile Range (IQR) | 2.0% | 2.3% |
| Standard Deviation (Sample) | 2.8% | 1.9% |
| Standard Deviation (Population) | 2.8% | 1.9% |
Demographics Similar to Immigrants from Yemen and Immigrants from El Salvador by No Schooling Completed
In terms of no schooling completed, the demographic groups most similar to Immigrants from Yemen are Spanish American Indian (4.2%, a difference of 1.5%), Nepalese (3.8%, a difference of 8.4%), Salvadoran (3.7%, a difference of 10.2%), Immigrants from Mexico (3.6%, a difference of 13.2%), and Immigrants from Central America (3.6%, a difference of 14.2%). Similarly, the demographic groups most similar to Immigrants from El Salvador are Nepalese (3.8%, a difference of 1.8%), Salvadoran (3.7%, a difference of 3.5%), Immigrants from Mexico (3.6%, a difference of 6.4%), Immigrants from Central America (3.6%, a difference of 7.3%), and Spanish American Indian (4.2%, a difference of 8.1%).
| Demographics | Rating | Rank | No Schooling Completed |
| Mexicans | 0.0 /100 | #328 | Tragic 3.3% |
| Immigrants | Vietnam | 0.0 /100 | #329 | Tragic 3.3% |
| Immigrants | Armenia | 0.0 /100 | #330 | Tragic 3.3% |
| Japanese | 0.0 /100 | #331 | Tragic 3.3% |
| Central Americans | 0.0 /100 | #332 | Tragic 3.4% |
| Immigrants | Dominican Republic | 0.0 /100 | #333 | Tragic 3.4% |
| Guatemalans | 0.0 /100 | #334 | Tragic 3.5% |
| Immigrants | Cambodia | 0.0 /100 | #335 | Tragic 3.5% |
| Immigrants | Fiji | 0.0 /100 | #336 | Tragic 3.5% |
| Immigrants | Cabo Verde | 0.0 /100 | #337 | Tragic 3.5% |
| Bangladeshis | 0.0 /100 | #338 | Tragic 3.5% |
| Yakama | 0.0 /100 | #339 | Tragic 3.6% |
| Immigrants | Guatemala | 0.0 /100 | #340 | Tragic 3.6% |
| Immigrants | Central America | 0.0 /100 | #341 | Tragic 3.6% |
| Immigrants | Mexico | 0.0 /100 | #342 | Tragic 3.6% |
| Salvadorans | 0.0 /100 | #343 | Tragic 3.7% |
| Nepalese | 0.0 /100 | #344 | Tragic 3.8% |
| Immigrants | El Salvador | 0.0 /100 | #345 | Tragic 3.9% |
| Immigrants | Yemen | 0.0 /100 | #346 | Tragic 4.1% |
| Spanish American Indians | 0.0 /100 | #347 | Tragic 4.2% |