Ethiopian vs Cree 1st Grade
COMPARE
Ethiopian
Cree
1st Grade
1st Grade Comparison
Ethiopians
Cree
97.6%
1ST GRADE
0.9/ 100
METRIC RATING
250th/ 347
METRIC RANK
98.2%
1ST GRADE
97.8/ 100
METRIC RATING
102nd/ 347
METRIC RANK
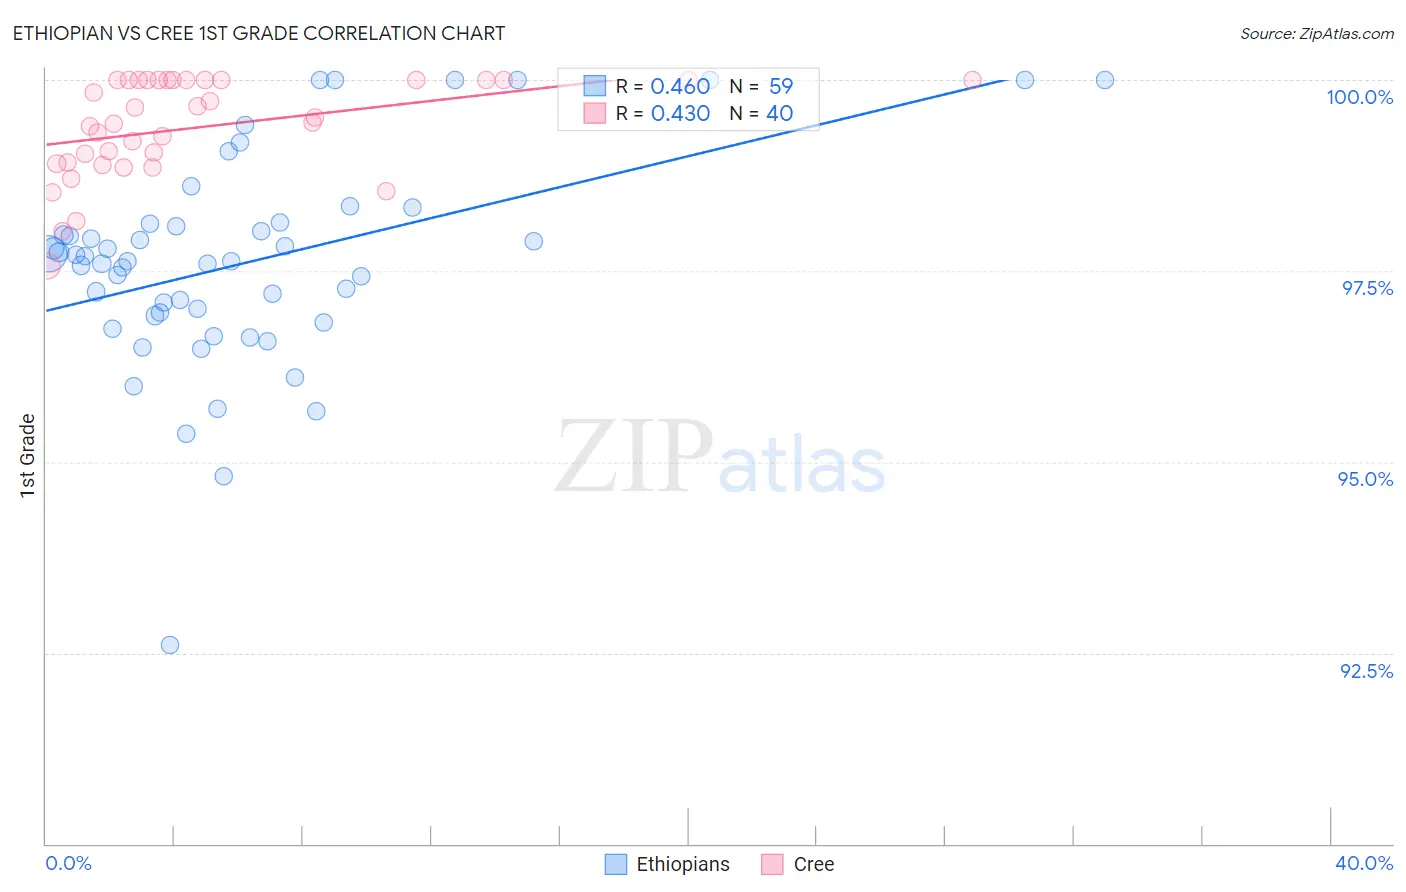
Ethiopian vs Cree 1st Grade Correlation Chart
The statistical analysis conducted on geographies consisting of 223,220,814 people shows a moderate positive correlation between the proportion of Ethiopians and percentage of population with at least 1st grade education in the United States with a correlation coefficient (R) of 0.460 and weighted average of 97.6%. Similarly, the statistical analysis conducted on geographies consisting of 76,204,399 people shows a moderate positive correlation between the proportion of Cree and percentage of population with at least 1st grade education in the United States with a correlation coefficient (R) of 0.430 and weighted average of 98.2%, a difference of 0.66%.
1st Grade Correlation Summary
| Measurement | Ethiopian | Cree |
| Minimum | 92.6% | 97.6% |
| Maximum | 100.0% | 100.0% |
| Range | 7.4% | 2.4% |
| Mean | 97.6% | 99.4% |
| Median | 97.6% | 99.5% |
| Interquartile 25% (IQ1) | 96.9% | 98.9% |
| Interquartile 75% (IQ3) | 98.1% | 100.0% |
| Interquartile Range (IQR) | 1.2% | 1.1% |
| Standard Deviation (Sample) | 1.4% | 0.65% |
| Standard Deviation (Population) | 1.4% | 0.64% |
Similar Demographics by 1st Grade
Demographics Similar to Ethiopians by 1st Grade
In terms of 1st grade, the demographic groups most similar to Ethiopians are Immigrants from Iraq (97.6%, a difference of 0.0%), South American (97.6%, a difference of 0.010%), Immigrants from Eastern Africa (97.6%, a difference of 0.010%), Peruvian (97.6%, a difference of 0.010%), and Immigrants from Middle Africa (97.6%, a difference of 0.010%).
| Demographics | Rating | Rank | 1st Grade |
| Bolivians | 1.2 /100 | #243 | Tragic 97.6% |
| Asians | 1.1 /100 | #244 | Tragic 97.6% |
| South Americans | 1.1 /100 | #245 | Tragic 97.6% |
| Immigrants | Eastern Africa | 1.0 /100 | #246 | Tragic 97.6% |
| Peruvians | 1.0 /100 | #247 | Tragic 97.6% |
| Immigrants | Middle Africa | 1.0 /100 | #248 | Tragic 97.6% |
| Immigrants | Senegal | 1.0 /100 | #249 | Tragic 97.6% |
| Ethiopians | 0.9 /100 | #250 | Tragic 97.6% |
| Immigrants | Iraq | 0.9 /100 | #251 | Tragic 97.6% |
| Immigrants | Africa | 0.9 /100 | #252 | Tragic 97.6% |
| Immigrants | Congo | 0.7 /100 | #253 | Tragic 97.5% |
| Immigrants | Asia | 0.7 /100 | #254 | Tragic 97.5% |
| Immigrants | Colombia | 0.6 /100 | #255 | Tragic 97.5% |
| Jamaicans | 0.6 /100 | #256 | Tragic 97.5% |
| Yaqui | 0.6 /100 | #257 | Tragic 97.5% |
Demographics Similar to Cree by 1st Grade
In terms of 1st grade, the demographic groups most similar to Cree are Romanian (98.2%, a difference of 0.0%), Immigrants from Ireland (98.2%, a difference of 0.0%), Colville (98.2%, a difference of 0.010%), Pima (98.2%, a difference of 0.010%), and Basque (98.2%, a difference of 0.010%).
| Demographics | Rating | Rank | 1st Grade |
| Immigrants | Germany | 98.5 /100 | #95 | Exceptional 98.2% |
| Cypriots | 98.3 /100 | #96 | Exceptional 98.2% |
| Immigrants | Nonimmigrants | 98.3 /100 | #97 | Exceptional 98.2% |
| Choctaw | 98.3 /100 | #98 | Exceptional 98.2% |
| Puget Sound Salish | 98.2 /100 | #99 | Exceptional 98.2% |
| Colville | 98.0 /100 | #100 | Exceptional 98.2% |
| Romanians | 97.8 /100 | #101 | Exceptional 98.2% |
| Cree | 97.8 /100 | #102 | Exceptional 98.2% |
| Immigrants | Ireland | 97.7 /100 | #103 | Exceptional 98.2% |
| Pima | 97.5 /100 | #104 | Exceptional 98.2% |
| Basques | 97.4 /100 | #105 | Exceptional 98.2% |
| Turks | 97.4 /100 | #106 | Exceptional 98.2% |
| Immigrants | Switzerland | 97.3 /100 | #107 | Exceptional 98.2% |
| Bhutanese | 97.3 /100 | #108 | Exceptional 98.2% |
| German Russians | 97.1 /100 | #109 | Exceptional 98.2% |