Immigrants from Dominica vs Belizean No Schooling Completed
COMPARE
Immigrants from Dominica
Belizean
No Schooling Completed
No Schooling Completed Comparison
Immigrants from Dominica
Belizeans
2.8%
NO SCHOOLING COMPLETED
0.0/ 100
METRIC RATING
298th/ 347
METRIC RANK
3.0%
NO SCHOOLING COMPLETED
0.0/ 100
METRIC RATING
306th/ 347
METRIC RANK
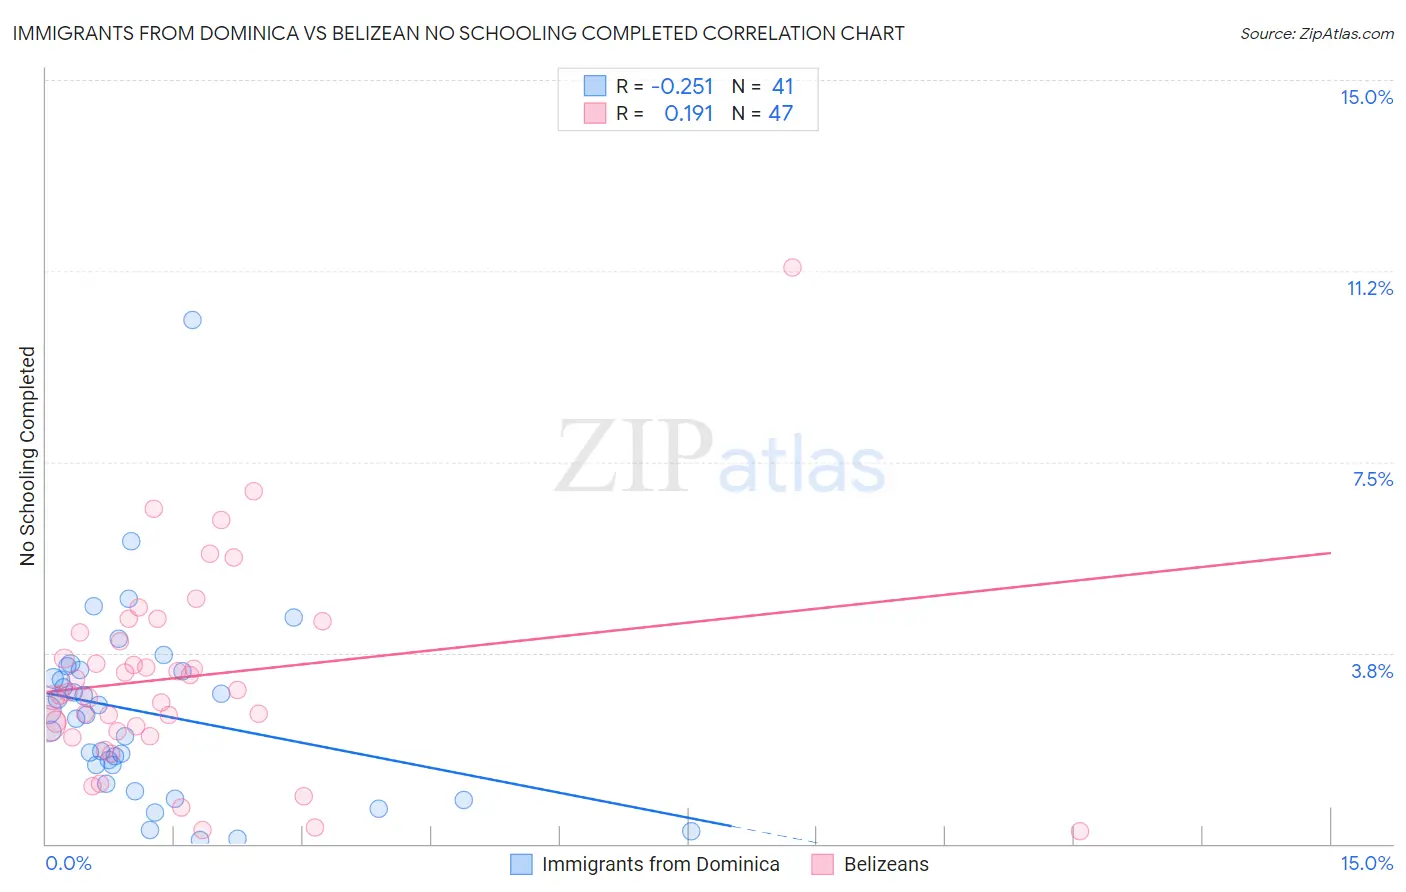
Immigrants from Dominica vs Belizean No Schooling Completed Correlation Chart
The statistical analysis conducted on geographies consisting of 83,717,936 people shows a weak negative correlation between the proportion of Immigrants from Dominica and percentage of population with no schooling in the United States with a correlation coefficient (R) of -0.251 and weighted average of 2.8%. Similarly, the statistical analysis conducted on geographies consisting of 143,887,803 people shows a poor positive correlation between the proportion of Belizeans and percentage of population with no schooling in the United States with a correlation coefficient (R) of 0.191 and weighted average of 3.0%, a difference of 6.1%.
No Schooling Completed Correlation Summary
| Measurement | Immigrants from Dominica | Belizean |
| Minimum | 0.065% | 0.25% |
| Maximum | 10.3% | 11.3% |
| Range | 10.2% | 11.1% |
| Mean | 2.6% | 3.3% |
| Median | 2.5% | 3.0% |
| Interquartile 25% (IQ1) | 1.4% | 2.2% |
| Interquartile 75% (IQ3) | 3.4% | 4.2% |
| Interquartile Range (IQR) | 2.0% | 1.9% |
| Standard Deviation (Sample) | 1.9% | 2.0% |
| Standard Deviation (Population) | 1.8% | 2.0% |
Demographics Similar to Immigrants from Dominica and Belizeans by No Schooling Completed
In terms of no schooling completed, the demographic groups most similar to Immigrants from Dominica are Immigrants from Cuba (2.8%, a difference of 0.33%), Central American Indian (2.8%, a difference of 0.51%), Haitian (2.9%, a difference of 0.83%), Immigrants (2.8%, a difference of 1.5%), and Houma (2.8%, a difference of 1.6%). Similarly, the demographic groups most similar to Belizeans are Immigrants from Haiti (3.0%, a difference of 0.080%), Immigrants from Somalia (3.0%, a difference of 0.24%), Hispanic or Latino (3.0%, a difference of 1.1%), Guyanese (3.0%, a difference of 1.1%), and Immigrants from the Azores (3.0%, a difference of 1.2%).
| Demographics | Rating | Rank | No Schooling Completed |
| Immigrants | Grenada | 0.0 /100 | #292 | Tragic 2.8% |
| Malaysians | 0.0 /100 | #293 | Tragic 2.8% |
| Immigrants | Eritrea | 0.0 /100 | #294 | Tragic 2.8% |
| Houma | 0.0 /100 | #295 | Tragic 2.8% |
| Immigrants | Immigrants | 0.0 /100 | #296 | Tragic 2.8% |
| Immigrants | Cuba | 0.0 /100 | #297 | Tragic 2.8% |
| Immigrants | Dominica | 0.0 /100 | #298 | Tragic 2.8% |
| Central American Indians | 0.0 /100 | #299 | Tragic 2.8% |
| Haitians | 0.0 /100 | #300 | Tragic 2.9% |
| Immigrants | South Eastern Asia | 0.0 /100 | #301 | Tragic 2.9% |
| Immigrants | Caribbean | 0.0 /100 | #302 | Tragic 2.9% |
| Somalis | 0.0 /100 | #303 | Tragic 2.9% |
| Nicaraguans | 0.0 /100 | #304 | Tragic 2.9% |
| Ecuadorians | 0.0 /100 | #305 | Tragic 3.0% |
| Belizeans | 0.0 /100 | #306 | Tragic 3.0% |
| Immigrants | Haiti | 0.0 /100 | #307 | Tragic 3.0% |
| Immigrants | Somalia | 0.0 /100 | #308 | Tragic 3.0% |
| Hispanics or Latinos | 0.0 /100 | #309 | Tragic 3.0% |
| Guyanese | 0.0 /100 | #310 | Tragic 3.0% |
| Immigrants | Azores | 0.0 /100 | #311 | Tragic 3.0% |
| Sri Lankans | 0.0 /100 | #312 | Tragic 3.0% |