Ethiopian vs Belizean In Labor Force | Age 16-19
COMPARE
Ethiopian
Belizean
In Labor Force | Age 16-19
In Labor Force | Age 16-19 Comparison
Ethiopians
Belizeans
38.2%
IN LABOR FORCE | AGE 16-19
97.4/ 100
METRIC RATING
121st/ 347
METRIC RANK
32.8%
IN LABOR FORCE | AGE 16-19
0.0/ 100
METRIC RATING
302nd/ 347
METRIC RANK
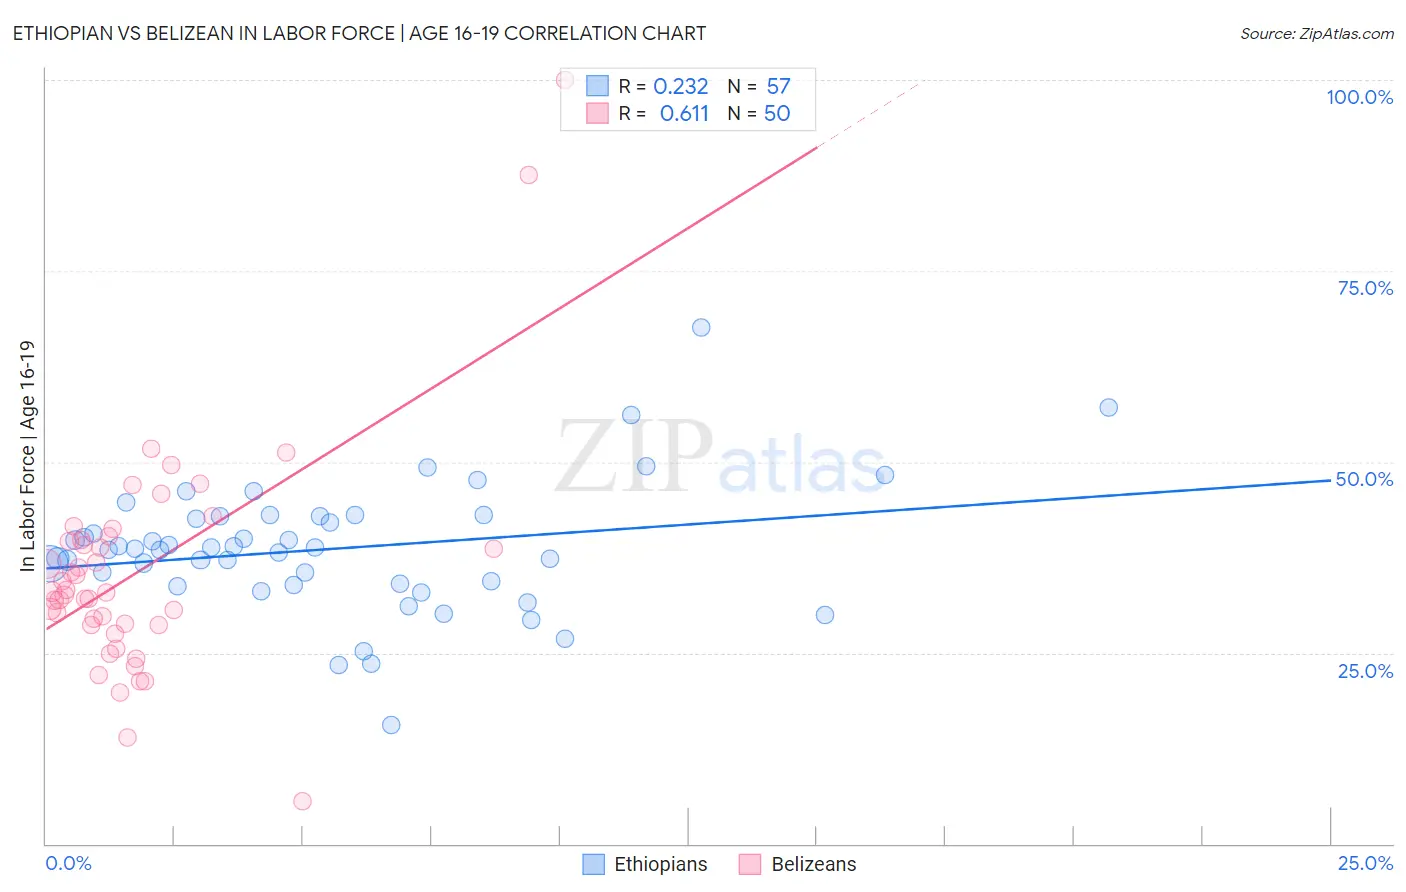
Ethiopian vs Belizean In Labor Force | Age 16-19 Correlation Chart
The statistical analysis conducted on geographies consisting of 223,172,424 people shows a weak positive correlation between the proportion of Ethiopians and labor force participation rate among population between the ages 16 and 19 in the United States with a correlation coefficient (R) of 0.232 and weighted average of 38.2%. Similarly, the statistical analysis conducted on geographies consisting of 144,124,652 people shows a significant positive correlation between the proportion of Belizeans and labor force participation rate among population between the ages 16 and 19 in the United States with a correlation coefficient (R) of 0.611 and weighted average of 32.8%, a difference of 16.7%.
In Labor Force | Age 16-19 Correlation Summary
| Measurement | Ethiopian | Belizean |
| Minimum | 15.6% | 5.5% |
| Maximum | 67.6% | 100.0% |
| Range | 52.0% | 94.5% |
| Mean | 38.6% | 35.7% |
| Median | 38.6% | 32.9% |
| Interquartile 25% (IQ1) | 34.0% | 28.7% |
| Interquartile 75% (IQ3) | 42.8% | 39.8% |
| Interquartile Range (IQR) | 8.9% | 11.2% |
| Standard Deviation (Sample) | 8.5% | 15.2% |
| Standard Deviation (Population) | 8.4% | 15.0% |
Similar Demographics by In Labor Force | Age 16-19
Demographics Similar to Ethiopians by In Labor Force | Age 16-19
In terms of in labor force | age 16-19, the demographic groups most similar to Ethiopians are Guamanian/Chamorro (38.2%, a difference of 0.030%), Ukrainian (38.3%, a difference of 0.11%), Assyrian/Chaldean/Syriac (38.3%, a difference of 0.19%), Immigrants from Nepal (38.3%, a difference of 0.21%), and Chickasaw (38.3%, a difference of 0.22%).
| Demographics | Rating | Rank | In Labor Force | Age 16-19 |
| Hawaiians | 98.2 /100 | #114 | Exceptional 38.4% |
| Bulgarians | 97.9 /100 | #115 | Exceptional 38.3% |
| Colville | 97.9 /100 | #116 | Exceptional 38.3% |
| Chickasaw | 97.8 /100 | #117 | Exceptional 38.3% |
| Immigrants | Nepal | 97.8 /100 | #118 | Exceptional 38.3% |
| Assyrians/Chaldeans/Syriacs | 97.8 /100 | #119 | Exceptional 38.3% |
| Ukrainians | 97.6 /100 | #120 | Exceptional 38.3% |
| Ethiopians | 97.4 /100 | #121 | Exceptional 38.2% |
| Guamanians/Chamorros | 97.4 /100 | #122 | Exceptional 38.2% |
| Seminole | 96.7 /100 | #123 | Exceptional 38.1% |
| Immigrants | England | 96.4 /100 | #124 | Exceptional 38.1% |
| Immigrants | Africa | 96.1 /100 | #125 | Exceptional 38.0% |
| Africans | 95.6 /100 | #126 | Exceptional 38.0% |
| Choctaw | 95.6 /100 | #127 | Exceptional 38.0% |
| New Zealanders | 95.6 /100 | #128 | Exceptional 38.0% |
Demographics Similar to Belizeans by In Labor Force | Age 16-19
In terms of in labor force | age 16-19, the demographic groups most similar to Belizeans are Okinawan (32.8%, a difference of 0.14%), Immigrants from Argentina (32.9%, a difference of 0.38%), Armenian (32.9%, a difference of 0.53%), Iranian (33.0%, a difference of 0.78%), and Immigrants from Dominica (32.5%, a difference of 0.90%).
| Demographics | Rating | Rank | In Labor Force | Age 16-19 |
| Yup'ik | 0.1 /100 | #295 | Tragic 33.3% |
| Jamaicans | 0.1 /100 | #296 | Tragic 33.2% |
| Immigrants | Haiti | 0.1 /100 | #297 | Tragic 33.2% |
| Iranians | 0.0 /100 | #298 | Tragic 33.0% |
| Armenians | 0.0 /100 | #299 | Tragic 32.9% |
| Immigrants | Argentina | 0.0 /100 | #300 | Tragic 32.9% |
| Okinawans | 0.0 /100 | #301 | Tragic 32.8% |
| Belizeans | 0.0 /100 | #302 | Tragic 32.8% |
| Immigrants | Dominica | 0.0 /100 | #303 | Tragic 32.5% |
| Israelis | 0.0 /100 | #304 | Tragic 32.4% |
| Nicaraguans | 0.0 /100 | #305 | Tragic 32.4% |
| Spanish American Indians | 0.0 /100 | #306 | Tragic 32.4% |
| Immigrants | Jamaica | 0.0 /100 | #307 | Tragic 32.2% |
| Navajo | 0.0 /100 | #308 | Tragic 32.1% |
| Immigrants | Eastern Asia | 0.0 /100 | #309 | Tragic 32.0% |