Syrian vs Belizean No Schooling Completed
COMPARE
Syrian
Belizean
No Schooling Completed
No Schooling Completed Comparison
Syrians
Belizeans
1.9%
NO SCHOOLING COMPLETED
96.0/ 100
METRIC RATING
115th/ 347
METRIC RANK
3.0%
NO SCHOOLING COMPLETED
0.0/ 100
METRIC RATING
306th/ 347
METRIC RANK
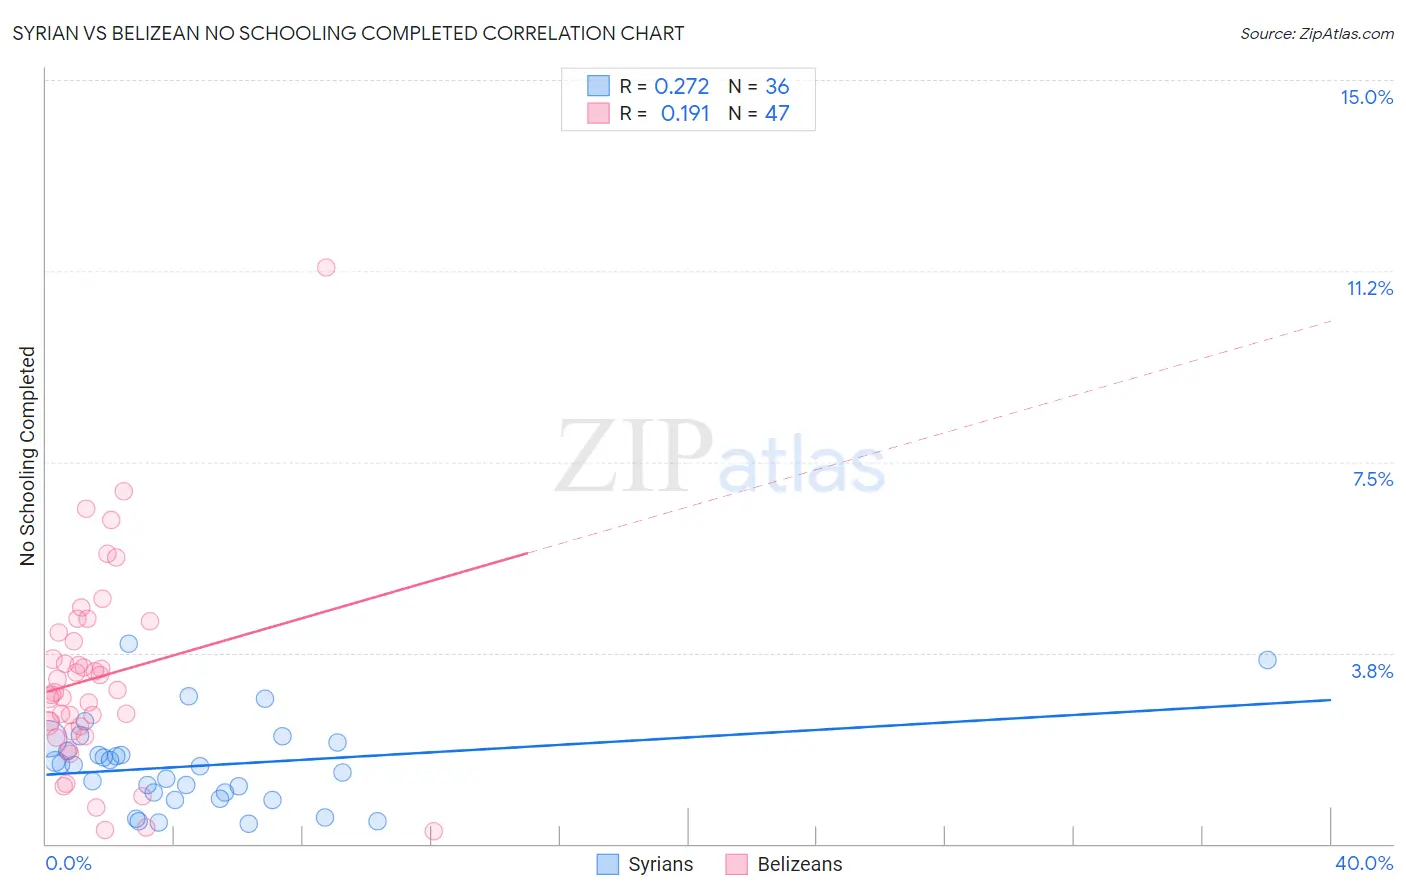
Syrian vs Belizean No Schooling Completed Correlation Chart
The statistical analysis conducted on geographies consisting of 264,321,115 people shows a weak positive correlation between the proportion of Syrians and percentage of population with no schooling in the United States with a correlation coefficient (R) of 0.272 and weighted average of 1.9%. Similarly, the statistical analysis conducted on geographies consisting of 143,887,803 people shows a poor positive correlation between the proportion of Belizeans and percentage of population with no schooling in the United States with a correlation coefficient (R) of 0.191 and weighted average of 3.0%, a difference of 60.9%.
No Schooling Completed Correlation Summary
| Measurement | Syrian | Belizean |
| Minimum | 0.39% | 0.25% |
| Maximum | 3.9% | 11.3% |
| Range | 3.5% | 11.1% |
| Mean | 1.5% | 3.3% |
| Median | 1.5% | 3.0% |
| Interquartile 25% (IQ1) | 0.93% | 2.2% |
| Interquartile 75% (IQ3) | 1.9% | 4.2% |
| Interquartile Range (IQR) | 0.97% | 1.9% |
| Standard Deviation (Sample) | 0.85% | 2.0% |
| Standard Deviation (Population) | 0.84% | 2.0% |
Similar Demographics by No Schooling Completed
Demographics Similar to Syrians by No Schooling Completed
In terms of no schooling completed, the demographic groups most similar to Syrians are Lebanese (1.9%, a difference of 0.020%), Immigrants from Norway (1.9%, a difference of 0.13%), Immigrants from Zimbabwe (1.9%, a difference of 0.14%), Immigrants from Serbia (1.9%, a difference of 0.22%), and Pueblo (1.9%, a difference of 0.38%).
| Demographics | Rating | Rank | No Schooling Completed |
| Okinawans | 97.1 /100 | #108 | Exceptional 1.8% |
| Immigrants | Saudi Arabia | 96.8 /100 | #109 | Exceptional 1.9% |
| Immigrants | Latvia | 96.7 /100 | #110 | Exceptional 1.9% |
| Immigrants | Japan | 96.6 /100 | #111 | Exceptional 1.9% |
| Pueblo | 96.4 /100 | #112 | Exceptional 1.9% |
| Immigrants | Zimbabwe | 96.2 /100 | #113 | Exceptional 1.9% |
| Immigrants | Norway | 96.1 /100 | #114 | Exceptional 1.9% |
| Syrians | 96.0 /100 | #115 | Exceptional 1.9% |
| Lebanese | 96.0 /100 | #116 | Exceptional 1.9% |
| Immigrants | Serbia | 95.8 /100 | #117 | Exceptional 1.9% |
| Spanish | 95.5 /100 | #118 | Exceptional 1.9% |
| Iroquois | 95.1 /100 | #119 | Exceptional 1.9% |
| Immigrants | Bulgaria | 94.6 /100 | #120 | Exceptional 1.9% |
| Immigrants | Croatia | 94.5 /100 | #121 | Exceptional 1.9% |
| Cree | 94.5 /100 | #122 | Exceptional 1.9% |
Demographics Similar to Belizeans by No Schooling Completed
In terms of no schooling completed, the demographic groups most similar to Belizeans are Immigrants from Haiti (3.0%, a difference of 0.080%), Immigrants from Somalia (3.0%, a difference of 0.24%), Hispanic or Latino (3.0%, a difference of 1.1%), Guyanese (3.0%, a difference of 1.1%), and Immigrants from the Azores (3.0%, a difference of 1.2%).
| Demographics | Rating | Rank | No Schooling Completed |
| Central American Indians | 0.0 /100 | #299 | Tragic 2.8% |
| Haitians | 0.0 /100 | #300 | Tragic 2.9% |
| Immigrants | South Eastern Asia | 0.0 /100 | #301 | Tragic 2.9% |
| Immigrants | Caribbean | 0.0 /100 | #302 | Tragic 2.9% |
| Somalis | 0.0 /100 | #303 | Tragic 2.9% |
| Nicaraguans | 0.0 /100 | #304 | Tragic 2.9% |
| Ecuadorians | 0.0 /100 | #305 | Tragic 3.0% |
| Belizeans | 0.0 /100 | #306 | Tragic 3.0% |
| Immigrants | Haiti | 0.0 /100 | #307 | Tragic 3.0% |
| Immigrants | Somalia | 0.0 /100 | #308 | Tragic 3.0% |
| Hispanics or Latinos | 0.0 /100 | #309 | Tragic 3.0% |
| Guyanese | 0.0 /100 | #310 | Tragic 3.0% |
| Immigrants | Azores | 0.0 /100 | #311 | Tragic 3.0% |
| Sri Lankans | 0.0 /100 | #312 | Tragic 3.0% |
| Hondurans | 0.0 /100 | #313 | Tragic 3.1% |