Ecuadorian vs Immigrants from Pakistan Doctorate Degree
COMPARE
Ecuadorian
Immigrants from Pakistan
Doctorate Degree
Doctorate Degree Comparison
Ecuadorians
Immigrants from Pakistan
1.5%
DOCTORATE DEGREE
0.4/ 100
METRIC RATING
280th/ 347
METRIC RANK
2.1%
DOCTORATE DEGREE
97.1/ 100
METRIC RATING
111th/ 347
METRIC RANK
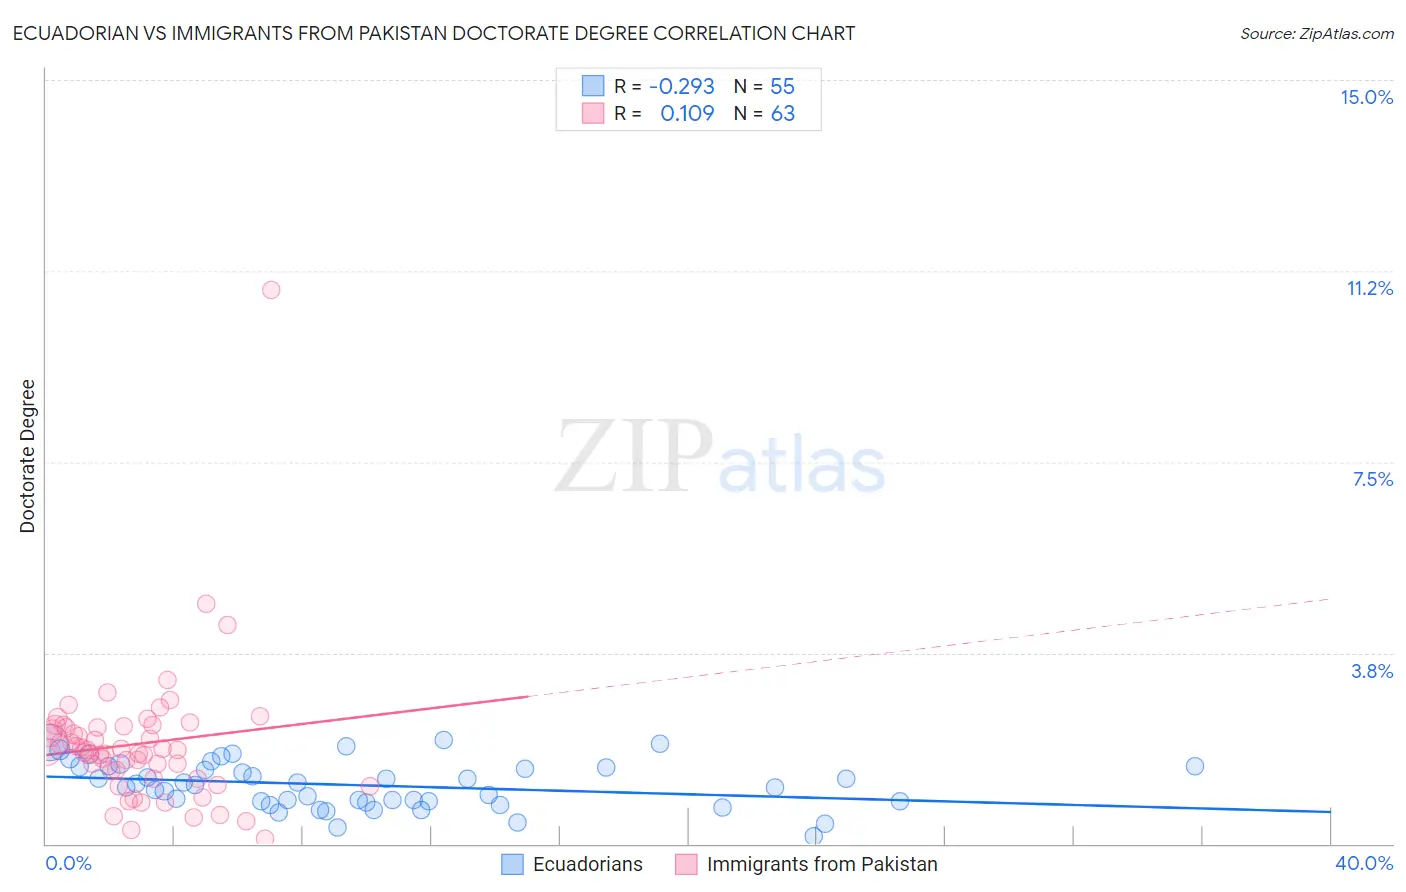
Ecuadorian vs Immigrants from Pakistan Doctorate Degree Correlation Chart
The statistical analysis conducted on geographies consisting of 316,205,329 people shows a weak negative correlation between the proportion of Ecuadorians and percentage of population with at least doctorate degree education in the United States with a correlation coefficient (R) of -0.293 and weighted average of 1.5%. Similarly, the statistical analysis conducted on geographies consisting of 283,055,701 people shows a poor positive correlation between the proportion of Immigrants from Pakistan and percentage of population with at least doctorate degree education in the United States with a correlation coefficient (R) of 0.109 and weighted average of 2.1%, a difference of 42.3%.
Doctorate Degree Correlation Summary
| Measurement | Ecuadorian | Immigrants from Pakistan |
| Minimum | 0.16% | 0.090% |
| Maximum | 2.0% | 10.9% |
| Range | 1.9% | 10.8% |
| Mean | 1.1% | 2.0% |
| Median | 1.2% | 1.8% |
| Interquartile 25% (IQ1) | 0.83% | 1.3% |
| Interquartile 75% (IQ3) | 1.5% | 2.3% |
| Interquartile Range (IQR) | 0.68% | 1.0% |
| Standard Deviation (Sample) | 0.46% | 1.4% |
| Standard Deviation (Population) | 0.45% | 1.4% |
Similar Demographics by Doctorate Degree
Demographics Similar to Ecuadorians by Doctorate Degree
In terms of doctorate degree, the demographic groups most similar to Ecuadorians are Marshallese (1.5%, a difference of 0.010%), Tohono O'odham (1.5%, a difference of 0.060%), British West Indian (1.5%, a difference of 0.12%), Central American (1.5%, a difference of 0.16%), and Jamaican (1.5%, a difference of 0.20%).
| Demographics | Rating | Rank | Doctorate Degree |
| Sioux | 0.4 /100 | #273 | Tragic 1.5% |
| Yaqui | 0.4 /100 | #274 | Tragic 1.5% |
| Aleuts | 0.4 /100 | #275 | Tragic 1.5% |
| Paiute | 0.4 /100 | #276 | Tragic 1.5% |
| Bahamians | 0.4 /100 | #277 | Tragic 1.5% |
| Hawaiians | 0.4 /100 | #278 | Tragic 1.5% |
| Marshallese | 0.4 /100 | #279 | Tragic 1.5% |
| Ecuadorians | 0.4 /100 | #280 | Tragic 1.5% |
| Tohono O'odham | 0.4 /100 | #281 | Tragic 1.5% |
| British West Indians | 0.3 /100 | #282 | Tragic 1.5% |
| Central Americans | 0.3 /100 | #283 | Tragic 1.5% |
| Jamaicans | 0.3 /100 | #284 | Tragic 1.5% |
| Malaysians | 0.3 /100 | #285 | Tragic 1.5% |
| Cherokee | 0.3 /100 | #286 | Tragic 1.5% |
| Cajuns | 0.3 /100 | #287 | Tragic 1.5% |
Demographics Similar to Immigrants from Pakistan by Doctorate Degree
In terms of doctorate degree, the demographic groups most similar to Immigrants from Pakistan are Syrian (2.1%, a difference of 0.020%), Brazilian (2.1%, a difference of 0.060%), Ukrainian (2.1%, a difference of 0.13%), Immigrants from Germany (2.1%, a difference of 0.19%), and Immigrants from Italy (2.1%, a difference of 0.23%).
| Demographics | Rating | Rank | Doctorate Degree |
| Austrians | 98.0 /100 | #104 | Exceptional 2.1% |
| Arabs | 97.8 /100 | #105 | Exceptional 2.1% |
| Sudanese | 97.7 /100 | #106 | Exceptional 2.1% |
| Europeans | 97.5 /100 | #107 | Exceptional 2.1% |
| Immigrants | Germany | 97.3 /100 | #108 | Exceptional 2.1% |
| Ukrainians | 97.2 /100 | #109 | Exceptional 2.1% |
| Brazilians | 97.2 /100 | #110 | Exceptional 2.1% |
| Immigrants | Pakistan | 97.1 /100 | #111 | Exceptional 2.1% |
| Syrians | 97.1 /100 | #112 | Exceptional 2.1% |
| Immigrants | Italy | 96.9 /100 | #113 | Exceptional 2.1% |
| Immigrants | Croatia | 96.8 /100 | #114 | Exceptional 2.1% |
| Taiwanese | 96.7 /100 | #115 | Exceptional 2.1% |
| Maltese | 96.2 /100 | #116 | Exceptional 2.1% |
| Lebanese | 96.0 /100 | #117 | Exceptional 2.1% |
| Icelanders | 96.0 /100 | #118 | Exceptional 2.1% |