Dutch West Indian vs Immigrants from Asia College, 1 year or more
COMPARE
Dutch West Indian
Immigrants from Asia
College, 1 year or more
College, 1 year or more Comparison
Dutch West Indians
Immigrants from Asia
50.5%
COLLEGE, 1 YEAR OR MORE
0.0/ 100
METRIC RATING
328th/ 347
METRIC RANK
64.0%
COLLEGE, 1 YEAR OR MORE
99.7/ 100
METRIC RATING
58th/ 347
METRIC RANK
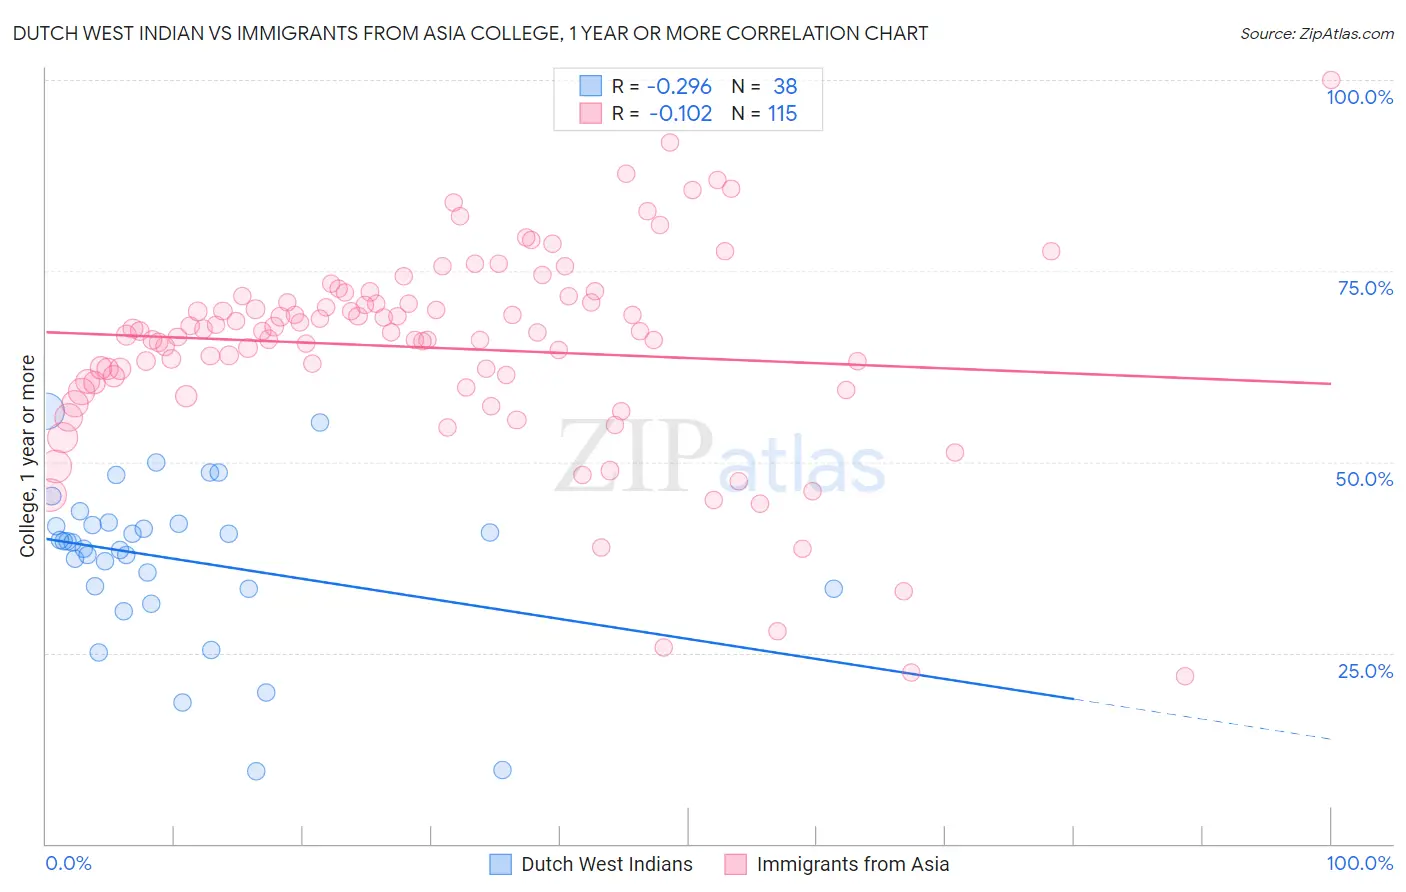
Dutch West Indian vs Immigrants from Asia College, 1 year or more Correlation Chart
The statistical analysis conducted on geographies consisting of 85,776,098 people shows a weak negative correlation between the proportion of Dutch West Indians and percentage of population with at least college, 1 year or more education in the United States with a correlation coefficient (R) of -0.296 and weighted average of 50.5%. Similarly, the statistical analysis conducted on geographies consisting of 549,164,299 people shows a poor negative correlation between the proportion of Immigrants from Asia and percentage of population with at least college, 1 year or more education in the United States with a correlation coefficient (R) of -0.102 and weighted average of 64.0%, a difference of 26.7%.
College, 1 year or more Correlation Summary
| Measurement | Dutch West Indian | Immigrants from Asia |
| Minimum | 9.5% | 22.0% |
| Maximum | 56.6% | 100.0% |
| Range | 47.1% | 78.0% |
| Mean | 37.3% | 64.9% |
| Median | 39.5% | 67.0% |
| Interquartile 25% (IQ1) | 33.3% | 60.3% |
| Interquartile 75% (IQ3) | 41.8% | 70.9% |
| Interquartile Range (IQR) | 8.5% | 10.6% |
| Standard Deviation (Sample) | 10.5% | 13.3% |
| Standard Deviation (Population) | 10.4% | 13.3% |
Similar Demographics by College, 1 year or more
Demographics Similar to Dutch West Indians by College, 1 year or more
In terms of college, 1 year or more, the demographic groups most similar to Dutch West Indians are Menominee (50.6%, a difference of 0.12%), Dominican (50.6%, a difference of 0.15%), Immigrants from Latin America (50.7%, a difference of 0.33%), Immigrants from Cuba (50.7%, a difference of 0.36%), and Immigrants from Guatemala (50.7%, a difference of 0.37%).
| Demographics | Rating | Rank | College, 1 year or more |
| Hopi | 0.0 /100 | #321 | Tragic 50.9% |
| Navajo | 0.0 /100 | #322 | Tragic 50.8% |
| Immigrants | Guatemala | 0.0 /100 | #323 | Tragic 50.7% |
| Immigrants | Cuba | 0.0 /100 | #324 | Tragic 50.7% |
| Immigrants | Latin America | 0.0 /100 | #325 | Tragic 50.7% |
| Dominicans | 0.0 /100 | #326 | Tragic 50.6% |
| Menominee | 0.0 /100 | #327 | Tragic 50.6% |
| Dutch West Indians | 0.0 /100 | #328 | Tragic 50.5% |
| Cape Verdeans | 0.0 /100 | #329 | Tragic 50.3% |
| Natives/Alaskans | 0.0 /100 | #330 | Tragic 50.2% |
| Immigrants | Yemen | 0.0 /100 | #331 | Tragic 50.0% |
| Mexicans | 0.0 /100 | #332 | Tragic 49.2% |
| Immigrants | Dominican Republic | 0.0 /100 | #333 | Tragic 49.1% |
| Lumbee | 0.0 /100 | #334 | Tragic 48.9% |
| Yuman | 0.0 /100 | #335 | Tragic 48.7% |
Demographics Similar to Immigrants from Asia by College, 1 year or more
In terms of college, 1 year or more, the demographic groups most similar to Immigrants from Asia are South African (64.1%, a difference of 0.14%), Immigrants from Czechoslovakia (64.1%, a difference of 0.15%), Immigrants from Belarus (64.1%, a difference of 0.18%), Zimbabwean (64.2%, a difference of 0.30%), and Asian (64.2%, a difference of 0.33%).
| Demographics | Rating | Rank | College, 1 year or more |
| Immigrants | Malaysia | 99.8 /100 | #51 | Exceptional 64.3% |
| Immigrants | Netherlands | 99.8 /100 | #52 | Exceptional 64.2% |
| Asians | 99.8 /100 | #53 | Exceptional 64.2% |
| Zimbabweans | 99.8 /100 | #54 | Exceptional 64.2% |
| Immigrants | Belarus | 99.7 /100 | #55 | Exceptional 64.1% |
| Immigrants | Czechoslovakia | 99.7 /100 | #56 | Exceptional 64.1% |
| South Africans | 99.7 /100 | #57 | Exceptional 64.1% |
| Immigrants | Asia | 99.7 /100 | #58 | Exceptional 64.0% |
| Immigrants | Serbia | 99.6 /100 | #59 | Exceptional 63.8% |
| Immigrants | Kazakhstan | 99.5 /100 | #60 | Exceptional 63.6% |
| Bolivians | 99.5 /100 | #61 | Exceptional 63.5% |
| Immigrants | Indonesia | 99.5 /100 | #62 | Exceptional 63.5% |
| Immigrants | Scotland | 99.4 /100 | #63 | Exceptional 63.4% |
| Immigrants | Spain | 99.4 /100 | #64 | Exceptional 63.4% |
| Maltese | 99.3 /100 | #65 | Exceptional 63.4% |