Dutch West Indian vs Immigrants from Latvia College, 1 year or more
COMPARE
Dutch West Indian
Immigrants from Latvia
College, 1 year or more
College, 1 year or more Comparison
Dutch West Indians
Immigrants from Latvia
50.5%
COLLEGE, 1 YEAR OR MORE
0.0/ 100
METRIC RATING
328th/ 347
METRIC RANK
64.8%
COLLEGE, 1 YEAR OR MORE
99.9/ 100
METRIC RATING
42nd/ 347
METRIC RANK
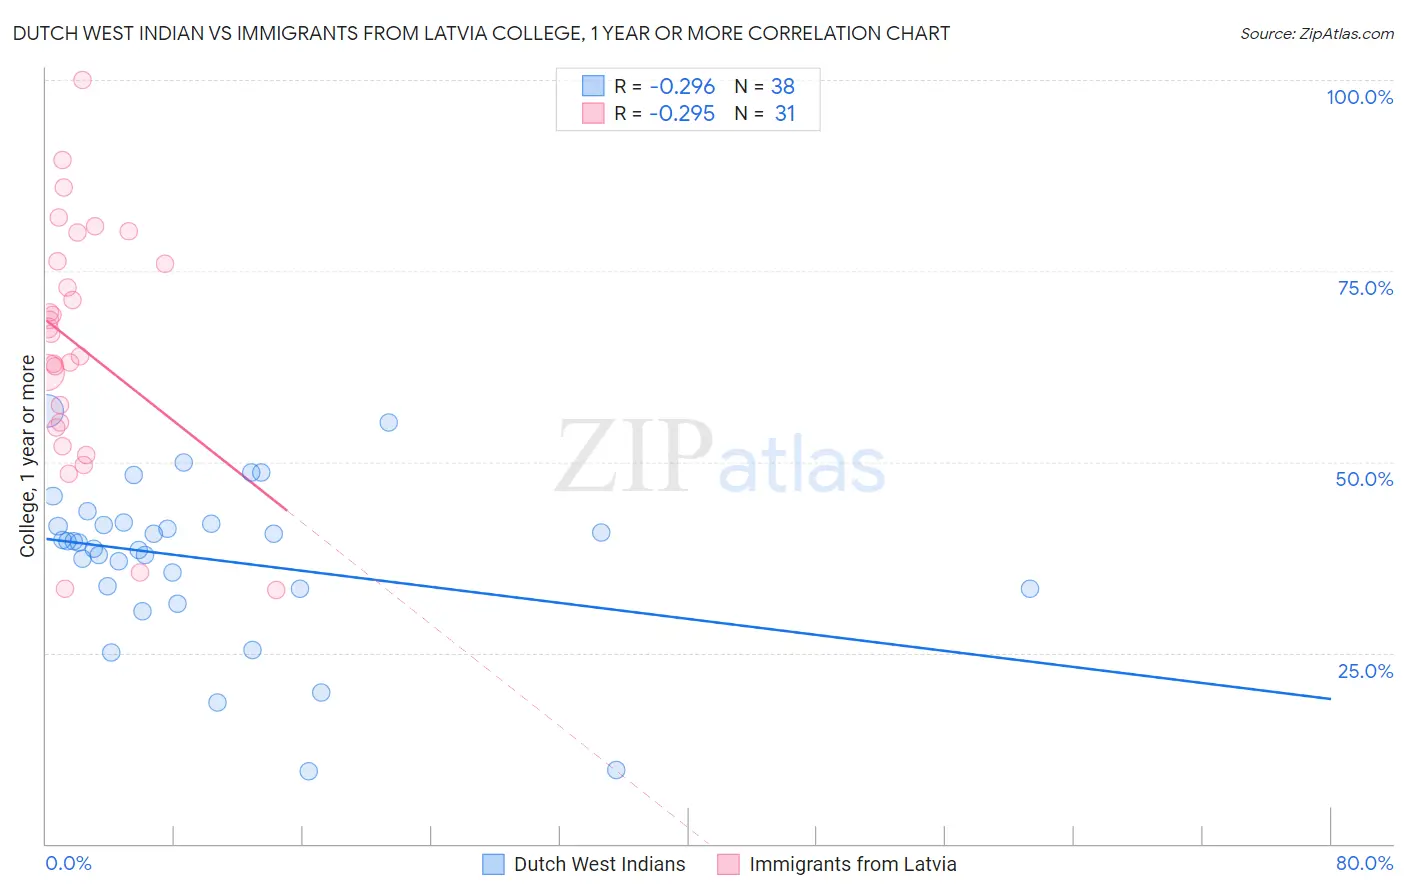
Dutch West Indian vs Immigrants from Latvia College, 1 year or more Correlation Chart
The statistical analysis conducted on geographies consisting of 85,776,098 people shows a weak negative correlation between the proportion of Dutch West Indians and percentage of population with at least college, 1 year or more education in the United States with a correlation coefficient (R) of -0.296 and weighted average of 50.5%. Similarly, the statistical analysis conducted on geographies consisting of 113,735,345 people shows a weak negative correlation between the proportion of Immigrants from Latvia and percentage of population with at least college, 1 year or more education in the United States with a correlation coefficient (R) of -0.295 and weighted average of 64.8%, a difference of 28.3%.
College, 1 year or more Correlation Summary
| Measurement | Dutch West Indian | Immigrants from Latvia |
| Minimum | 9.5% | 33.2% |
| Maximum | 56.6% | 100.0% |
| Range | 47.1% | 66.8% |
| Mean | 37.3% | 65.2% |
| Median | 39.5% | 66.8% |
| Interquartile 25% (IQ1) | 33.3% | 54.4% |
| Interquartile 75% (IQ3) | 41.8% | 76.2% |
| Interquartile Range (IQR) | 8.5% | 21.8% |
| Standard Deviation (Sample) | 10.5% | 16.0% |
| Standard Deviation (Population) | 10.4% | 15.8% |
Similar Demographics by College, 1 year or more
Demographics Similar to Dutch West Indians by College, 1 year or more
In terms of college, 1 year or more, the demographic groups most similar to Dutch West Indians are Menominee (50.6%, a difference of 0.12%), Dominican (50.6%, a difference of 0.15%), Immigrants from Latin America (50.7%, a difference of 0.33%), Immigrants from Cuba (50.7%, a difference of 0.36%), and Immigrants from Guatemala (50.7%, a difference of 0.37%).
| Demographics | Rating | Rank | College, 1 year or more |
| Hopi | 0.0 /100 | #321 | Tragic 50.9% |
| Navajo | 0.0 /100 | #322 | Tragic 50.8% |
| Immigrants | Guatemala | 0.0 /100 | #323 | Tragic 50.7% |
| Immigrants | Cuba | 0.0 /100 | #324 | Tragic 50.7% |
| Immigrants | Latin America | 0.0 /100 | #325 | Tragic 50.7% |
| Dominicans | 0.0 /100 | #326 | Tragic 50.6% |
| Menominee | 0.0 /100 | #327 | Tragic 50.6% |
| Dutch West Indians | 0.0 /100 | #328 | Tragic 50.5% |
| Cape Verdeans | 0.0 /100 | #329 | Tragic 50.3% |
| Natives/Alaskans | 0.0 /100 | #330 | Tragic 50.2% |
| Immigrants | Yemen | 0.0 /100 | #331 | Tragic 50.0% |
| Mexicans | 0.0 /100 | #332 | Tragic 49.2% |
| Immigrants | Dominican Republic | 0.0 /100 | #333 | Tragic 49.1% |
| Lumbee | 0.0 /100 | #334 | Tragic 48.9% |
| Yuman | 0.0 /100 | #335 | Tragic 48.7% |
Demographics Similar to Immigrants from Latvia by College, 1 year or more
In terms of college, 1 year or more, the demographic groups most similar to Immigrants from Latvia are Mongolian (64.8%, a difference of 0.010%), Immigrants from Russia (64.7%, a difference of 0.12%), Immigrants from Norway (64.7%, a difference of 0.14%), Immigrants from Kuwait (65.0%, a difference of 0.21%), and Estonian (65.0%, a difference of 0.27%).
| Demographics | Rating | Rank | College, 1 year or more |
| Immigrants | Turkey | 99.9 /100 | #35 | Exceptional 65.2% |
| Immigrants | South Africa | 99.9 /100 | #36 | Exceptional 65.1% |
| Russians | 99.9 /100 | #37 | Exceptional 65.1% |
| Immigrants | Saudi Arabia | 99.9 /100 | #38 | Exceptional 65.0% |
| Estonians | 99.9 /100 | #39 | Exceptional 65.0% |
| Immigrants | Kuwait | 99.9 /100 | #40 | Exceptional 65.0% |
| Mongolians | 99.9 /100 | #41 | Exceptional 64.8% |
| Immigrants | Latvia | 99.9 /100 | #42 | Exceptional 64.8% |
| Immigrants | Russia | 99.9 /100 | #43 | Exceptional 64.7% |
| Immigrants | Norway | 99.9 /100 | #44 | Exceptional 64.7% |
| Immigrants | Lithuania | 99.9 /100 | #45 | Exceptional 64.6% |
| Bhutanese | 99.9 /100 | #46 | Exceptional 64.6% |
| Australians | 99.9 /100 | #47 | Exceptional 64.6% |
| Immigrants | Bulgaria | 99.9 /100 | #48 | Exceptional 64.6% |
| New Zealanders | 99.9 /100 | #49 | Exceptional 64.6% |