Dutch West Indian vs Immigrants from Laos College, 1 year or more
COMPARE
Dutch West Indian
Immigrants from Laos
College, 1 year or more
College, 1 year or more Comparison
Dutch West Indians
Immigrants from Laos
50.5%
COLLEGE, 1 YEAR OR MORE
0.0/ 100
METRIC RATING
328th/ 347
METRIC RANK
54.7%
COLLEGE, 1 YEAR OR MORE
0.2/ 100
METRIC RATING
265th/ 347
METRIC RANK
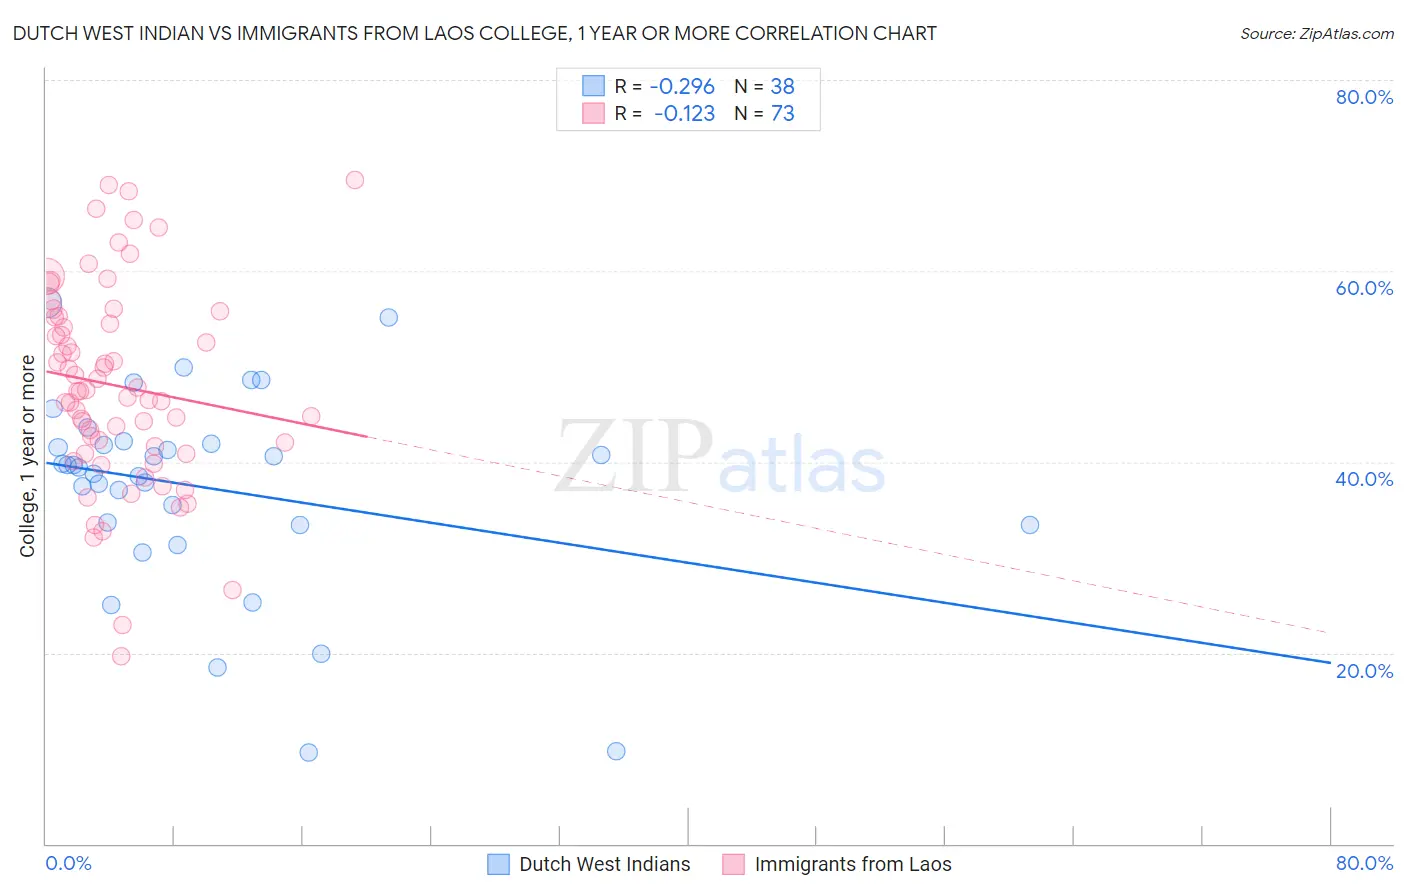
Dutch West Indian vs Immigrants from Laos College, 1 year or more Correlation Chart
The statistical analysis conducted on geographies consisting of 85,776,098 people shows a weak negative correlation between the proportion of Dutch West Indians and percentage of population with at least college, 1 year or more education in the United States with a correlation coefficient (R) of -0.296 and weighted average of 50.5%. Similarly, the statistical analysis conducted on geographies consisting of 201,475,535 people shows a poor negative correlation between the proportion of Immigrants from Laos and percentage of population with at least college, 1 year or more education in the United States with a correlation coefficient (R) of -0.123 and weighted average of 54.7%, a difference of 8.3%.
College, 1 year or more Correlation Summary
| Measurement | Dutch West Indian | Immigrants from Laos |
| Minimum | 9.5% | 19.6% |
| Maximum | 56.6% | 69.6% |
| Range | 47.1% | 49.9% |
| Mean | 37.3% | 48.0% |
| Median | 39.5% | 47.5% |
| Interquartile 25% (IQ1) | 33.3% | 41.3% |
| Interquartile 75% (IQ3) | 41.8% | 55.2% |
| Interquartile Range (IQR) | 8.5% | 13.9% |
| Standard Deviation (Sample) | 10.5% | 10.5% |
| Standard Deviation (Population) | 10.4% | 10.4% |
Similar Demographics by College, 1 year or more
Demographics Similar to Dutch West Indians by College, 1 year or more
In terms of college, 1 year or more, the demographic groups most similar to Dutch West Indians are Menominee (50.6%, a difference of 0.12%), Dominican (50.6%, a difference of 0.15%), Immigrants from Latin America (50.7%, a difference of 0.33%), Immigrants from Cuba (50.7%, a difference of 0.36%), and Immigrants from Guatemala (50.7%, a difference of 0.37%).
| Demographics | Rating | Rank | College, 1 year or more |
| Hopi | 0.0 /100 | #321 | Tragic 50.9% |
| Navajo | 0.0 /100 | #322 | Tragic 50.8% |
| Immigrants | Guatemala | 0.0 /100 | #323 | Tragic 50.7% |
| Immigrants | Cuba | 0.0 /100 | #324 | Tragic 50.7% |
| Immigrants | Latin America | 0.0 /100 | #325 | Tragic 50.7% |
| Dominicans | 0.0 /100 | #326 | Tragic 50.6% |
| Menominee | 0.0 /100 | #327 | Tragic 50.6% |
| Dutch West Indians | 0.0 /100 | #328 | Tragic 50.5% |
| Cape Verdeans | 0.0 /100 | #329 | Tragic 50.3% |
| Natives/Alaskans | 0.0 /100 | #330 | Tragic 50.2% |
| Immigrants | Yemen | 0.0 /100 | #331 | Tragic 50.0% |
| Mexicans | 0.0 /100 | #332 | Tragic 49.2% |
| Immigrants | Dominican Republic | 0.0 /100 | #333 | Tragic 49.1% |
| Lumbee | 0.0 /100 | #334 | Tragic 48.9% |
| Yuman | 0.0 /100 | #335 | Tragic 48.7% |
Demographics Similar to Immigrants from Laos by College, 1 year or more
In terms of college, 1 year or more, the demographic groups most similar to Immigrants from Laos are Potawatomi (54.6%, a difference of 0.050%), Blackfeet (54.6%, a difference of 0.12%), Immigrants from Micronesia (54.8%, a difference of 0.19%), U.S. Virgin Islander (54.8%, a difference of 0.22%), and Immigrants from St. Vincent and the Grenadines (54.8%, a difference of 0.24%).
| Demographics | Rating | Rank | College, 1 year or more |
| Africans | 0.4 /100 | #258 | Tragic 55.0% |
| Nepalese | 0.3 /100 | #259 | Tragic 54.9% |
| Jamaicans | 0.3 /100 | #260 | Tragic 54.9% |
| Ottawa | 0.3 /100 | #261 | Tragic 54.9% |
| Immigrants | St. Vincent and the Grenadines | 0.3 /100 | #262 | Tragic 54.8% |
| U.S. Virgin Islanders | 0.3 /100 | #263 | Tragic 54.8% |
| Immigrants | Micronesia | 0.3 /100 | #264 | Tragic 54.8% |
| Immigrants | Laos | 0.2 /100 | #265 | Tragic 54.7% |
| Potawatomi | 0.2 /100 | #266 | Tragic 54.6% |
| Blackfeet | 0.2 /100 | #267 | Tragic 54.6% |
| British West Indians | 0.2 /100 | #268 | Tragic 54.5% |
| Bangladeshis | 0.2 /100 | #269 | Tragic 54.5% |
| Crow | 0.2 /100 | #270 | Tragic 54.5% |
| Bahamians | 0.2 /100 | #271 | Tragic 54.5% |
| Comanche | 0.2 /100 | #272 | Tragic 54.4% |