Dutch West Indian vs Alsatian In Labor Force | Age 45-54
COMPARE
Dutch West Indian
Alsatian
In Labor Force | Age 45-54
In Labor Force | Age 45-54 Comparison
Dutch West Indians
Alsatians
78.2%
IN LABOR FORCE | AGE 45-54
0.0/ 100
METRIC RATING
324th/ 347
METRIC RANK
81.3%
IN LABOR FORCE | AGE 45-54
0.0/ 100
METRIC RATING
269th/ 347
METRIC RANK
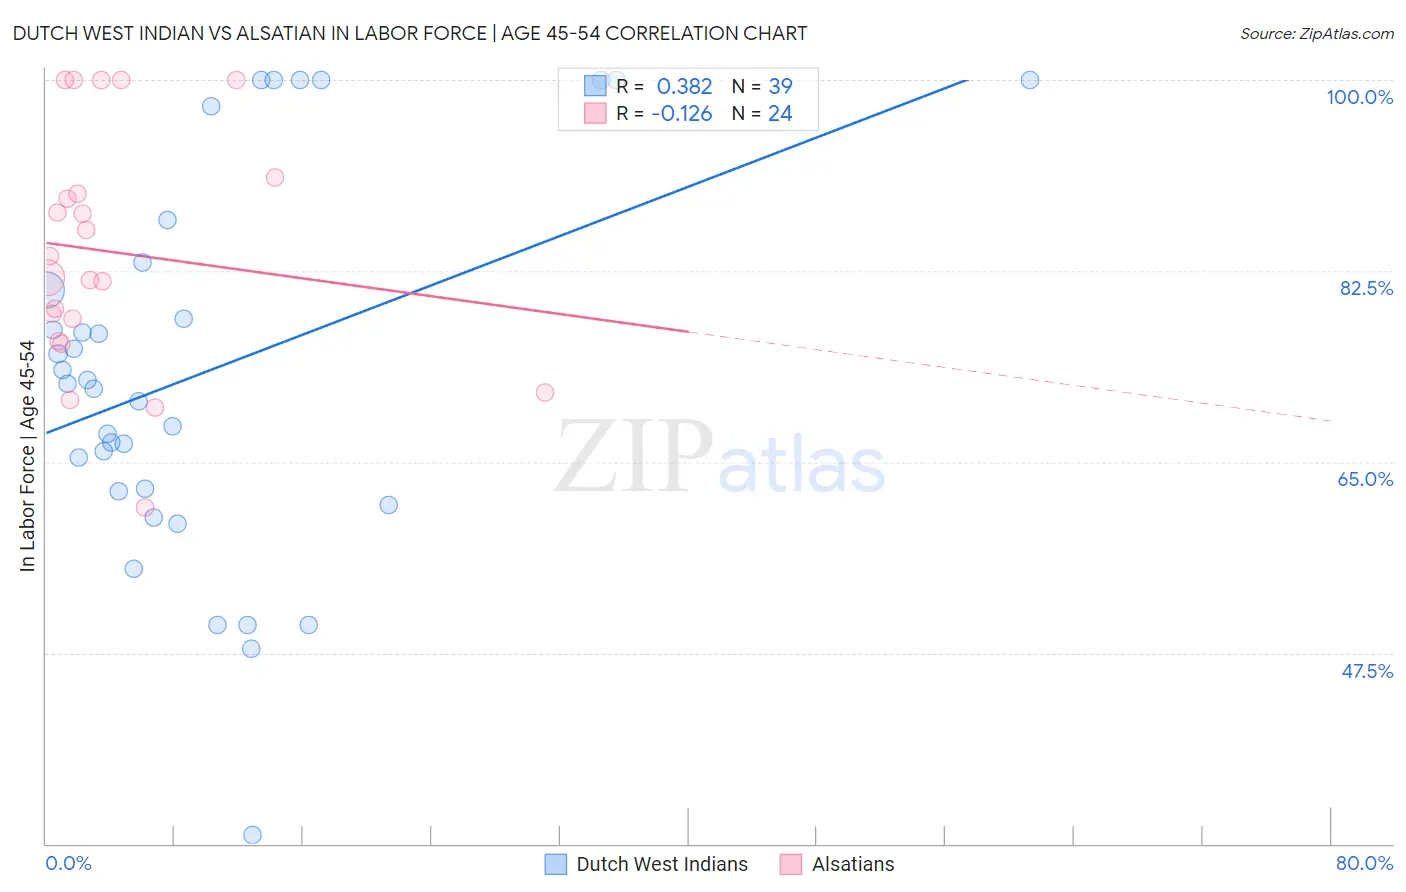
Dutch West Indian vs Alsatian In Labor Force | Age 45-54 Correlation Chart
The statistical analysis conducted on geographies consisting of 85,763,377 people shows a mild positive correlation between the proportion of Dutch West Indians and labor force participation rate among population between the ages 45 and 54 in the United States with a correlation coefficient (R) of 0.382 and weighted average of 78.2%. Similarly, the statistical analysis conducted on geographies consisting of 82,679,176 people shows a poor negative correlation between the proportion of Alsatians and labor force participation rate among population between the ages 45 and 54 in the United States with a correlation coefficient (R) of -0.126 and weighted average of 81.3%, a difference of 4.0%.
In Labor Force | Age 45-54 Correlation Summary
| Measurement | Dutch West Indian | Alsatian |
| Minimum | 30.8% | 60.8% |
| Maximum | 100.0% | 100.0% |
| Range | 69.2% | 39.2% |
| Mean | 73.3% | 84.2% |
| Median | 72.2% | 82.9% |
| Interquartile 25% (IQ1) | 62.3% | 77.1% |
| Interquartile 75% (IQ3) | 83.3% | 90.3% |
| Interquartile Range (IQR) | 21.0% | 13.2% |
| Standard Deviation (Sample) | 17.4% | 10.9% |
| Standard Deviation (Population) | 17.1% | 10.7% |
Similar Demographics by In Labor Force | Age 45-54
Demographics Similar to Dutch West Indians by In Labor Force | Age 45-54
In terms of in labor force | age 45-54, the demographic groups most similar to Dutch West Indians are Kiowa (78.3%, a difference of 0.020%), Choctaw (78.2%, a difference of 0.090%), Crow (78.3%, a difference of 0.10%), Seminole (78.1%, a difference of 0.14%), and Cajun (78.1%, a difference of 0.15%).
| Demographics | Rating | Rank | In Labor Force | Age 45-54 |
| Comanche | 0.0 /100 | #317 | Tragic 79.2% |
| Chickasaw | 0.0 /100 | #318 | Tragic 79.0% |
| Cherokee | 0.0 /100 | #319 | Tragic 79.0% |
| Yaqui | 0.0 /100 | #320 | Tragic 78.9% |
| Yup'ik | 0.0 /100 | #321 | Tragic 78.6% |
| Crow | 0.0 /100 | #322 | Tragic 78.3% |
| Kiowa | 0.0 /100 | #323 | Tragic 78.3% |
| Dutch West Indians | 0.0 /100 | #324 | Tragic 78.2% |
| Choctaw | 0.0 /100 | #325 | Tragic 78.2% |
| Seminole | 0.0 /100 | #326 | Tragic 78.1% |
| Cajuns | 0.0 /100 | #327 | Tragic 78.1% |
| Sioux | 0.0 /100 | #328 | Tragic 78.0% |
| Creek | 0.0 /100 | #329 | Tragic 77.7% |
| Cheyenne | 0.0 /100 | #330 | Tragic 77.6% |
| Tsimshian | 0.0 /100 | #331 | Tragic 77.4% |
Demographics Similar to Alsatians by In Labor Force | Age 45-54
In terms of in labor force | age 45-54, the demographic groups most similar to Alsatians are Immigrants from Honduras (81.4%, a difference of 0.020%), Bangladeshi (81.3%, a difference of 0.030%), West Indian (81.4%, a difference of 0.040%), Immigrants from Barbados (81.3%, a difference of 0.040%), and Spanish (81.3%, a difference of 0.040%).
| Demographics | Rating | Rank | In Labor Force | Age 45-54 |
| Immigrants | Guyana | 0.1 /100 | #262 | Tragic 81.5% |
| Indonesians | 0.1 /100 | #263 | Tragic 81.5% |
| Immigrants | West Indies | 0.1 /100 | #264 | Tragic 81.5% |
| Hondurans | 0.1 /100 | #265 | Tragic 81.4% |
| Immigrants | St. Vincent and the Grenadines | 0.1 /100 | #266 | Tragic 81.4% |
| West Indians | 0.1 /100 | #267 | Tragic 81.4% |
| Immigrants | Honduras | 0.0 /100 | #268 | Tragic 81.4% |
| Alsatians | 0.0 /100 | #269 | Tragic 81.3% |
| Bangladeshis | 0.0 /100 | #270 | Tragic 81.3% |
| Immigrants | Barbados | 0.0 /100 | #271 | Tragic 81.3% |
| Spanish | 0.0 /100 | #272 | Tragic 81.3% |
| Chippewa | 0.0 /100 | #273 | Tragic 81.3% |
| British West Indians | 0.0 /100 | #274 | Tragic 81.2% |
| Immigrants | Nonimmigrants | 0.0 /100 | #275 | Tragic 81.2% |
| U.S. Virgin Islanders | 0.0 /100 | #276 | Tragic 81.2% |