Dominican vs Soviet Union No Schooling Completed
COMPARE
Dominican
Soviet Union
No Schooling Completed
No Schooling Completed Comparison
Dominicans
Soviet Union
3.2%
NO SCHOOLING COMPLETED
0.0/ 100
METRIC RATING
325th/ 347
METRIC RANK
2.0%
NO SCHOOLING COMPLETED
77.1/ 100
METRIC RATING
147th/ 347
METRIC RANK
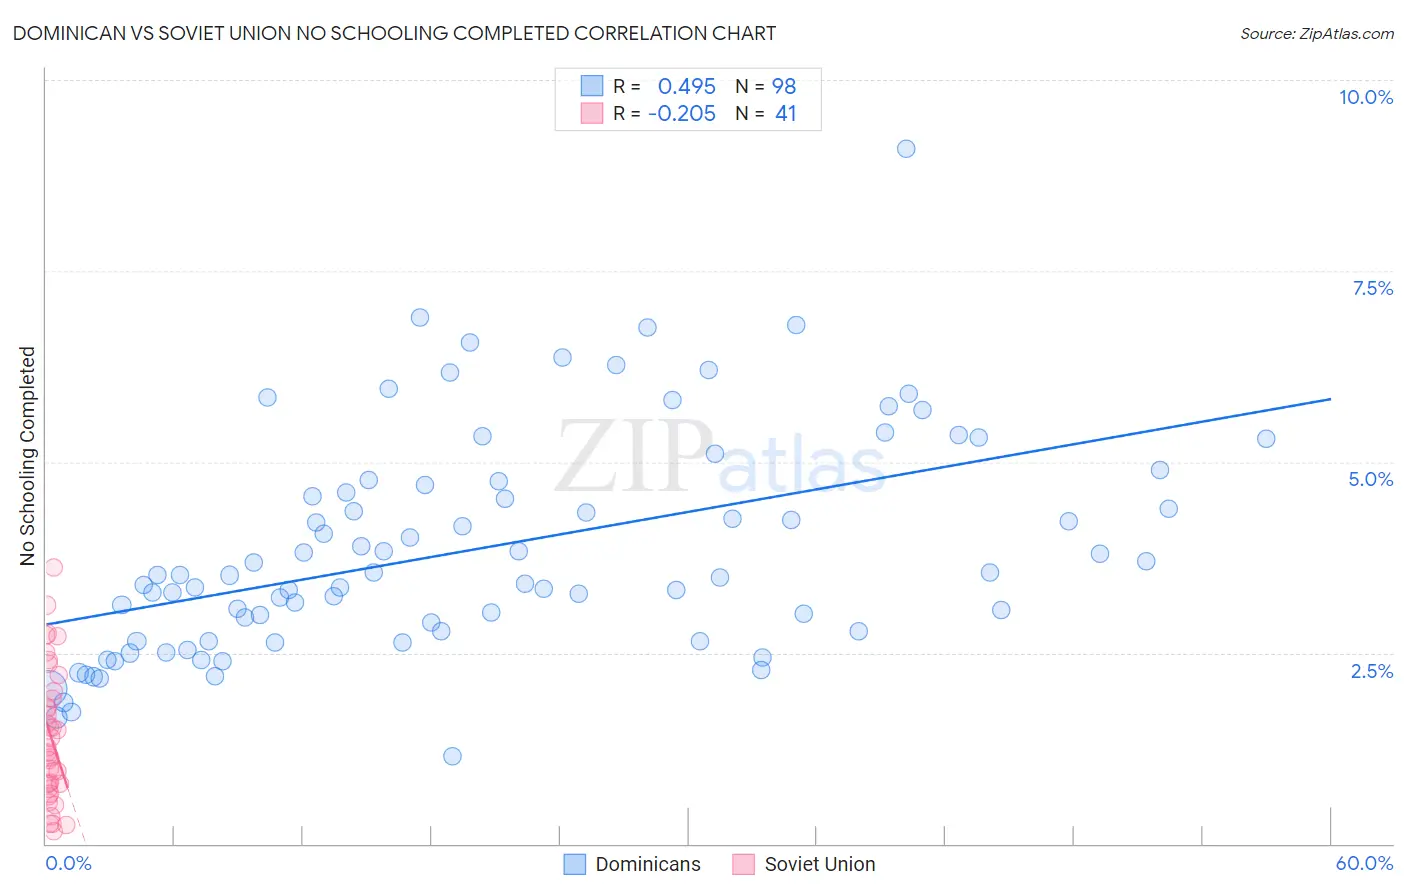
Dominican vs Soviet Union No Schooling Completed Correlation Chart
The statistical analysis conducted on geographies consisting of 352,198,650 people shows a moderate positive correlation between the proportion of Dominicans and percentage of population with no schooling in the United States with a correlation coefficient (R) of 0.495 and weighted average of 3.2%. Similarly, the statistical analysis conducted on geographies consisting of 43,404,550 people shows a weak negative correlation between the proportion of Soviet Union and percentage of population with no schooling in the United States with a correlation coefficient (R) of -0.205 and weighted average of 2.0%, a difference of 60.0%.
No Schooling Completed Correlation Summary
| Measurement | Dominican | Soviet Union |
| Minimum | 1.2% | 0.17% |
| Maximum | 9.1% | 3.6% |
| Range | 8.0% | 3.4% |
| Mean | 3.9% | 1.4% |
| Median | 3.5% | 1.2% |
| Interquartile 25% (IQ1) | 2.8% | 0.75% |
| Interquartile 75% (IQ3) | 4.7% | 1.9% |
| Interquartile Range (IQR) | 1.9% | 1.2% |
| Standard Deviation (Sample) | 1.4% | 0.87% |
| Standard Deviation (Population) | 1.4% | 0.86% |
Similar Demographics by No Schooling Completed
Demographics Similar to Dominicans by No Schooling Completed
In terms of no schooling completed, the demographic groups most similar to Dominicans are Indonesian (3.2%, a difference of 0.030%), Mexican American Indian (3.2%, a difference of 0.67%), Vietnamese (3.2%, a difference of 1.0%), Immigrants from Honduras (3.2%, a difference of 1.2%), and Immigrants from Laos (3.1%, a difference of 1.9%).
| Demographics | Rating | Rank | No Schooling Completed |
| Immigrants | Guyana | 0.0 /100 | #318 | Tragic 3.1% |
| Immigrants | Burma/Myanmar | 0.0 /100 | #319 | Tragic 3.1% |
| Immigrants | Bangladesh | 0.0 /100 | #320 | Tragic 3.1% |
| Immigrants | Laos | 0.0 /100 | #321 | Tragic 3.1% |
| Immigrants | Honduras | 0.0 /100 | #322 | Tragic 3.2% |
| Vietnamese | 0.0 /100 | #323 | Tragic 3.2% |
| Mexican American Indians | 0.0 /100 | #324 | Tragic 3.2% |
| Dominicans | 0.0 /100 | #325 | Tragic 3.2% |
| Indonesians | 0.0 /100 | #326 | Tragic 3.2% |
| Immigrants | Latin America | 0.0 /100 | #327 | Tragic 3.3% |
| Mexicans | 0.0 /100 | #328 | Tragic 3.3% |
| Immigrants | Vietnam | 0.0 /100 | #329 | Tragic 3.3% |
| Immigrants | Armenia | 0.0 /100 | #330 | Tragic 3.3% |
| Japanese | 0.0 /100 | #331 | Tragic 3.3% |
| Central Americans | 0.0 /100 | #332 | Tragic 3.4% |
Demographics Similar to Soviet Union by No Schooling Completed
In terms of no schooling completed, the demographic groups most similar to Soviet Union are Shoshone (2.0%, a difference of 0.080%), Immigrants from Moldova (2.0%, a difference of 0.17%), Immigrants from North Macedonia (2.0%, a difference of 0.24%), Immigrants from Iran (2.0%, a difference of 0.39%), and Alsatian (2.0%, a difference of 0.40%).
| Demographics | Rating | Rank | No Schooling Completed |
| Marshallese | 83.5 /100 | #140 | Excellent 2.0% |
| Immigrants | Greece | 83.5 /100 | #141 | Excellent 2.0% |
| Venezuelans | 81.5 /100 | #142 | Excellent 2.0% |
| Immigrants | South Central Asia | 80.0 /100 | #143 | Good 2.0% |
| Alsatians | 79.1 /100 | #144 | Good 2.0% |
| Immigrants | Iran | 79.0 /100 | #145 | Good 2.0% |
| Immigrants | Moldova | 78.0 /100 | #146 | Good 2.0% |
| Soviet Union | 77.1 /100 | #147 | Good 2.0% |
| Shoshone | 76.7 /100 | #148 | Good 2.0% |
| Immigrants | North Macedonia | 75.9 /100 | #149 | Good 2.0% |
| Blackfeet | 72.9 /100 | #150 | Good 2.0% |
| Immigrants | Jordan | 70.9 /100 | #151 | Good 2.0% |
| Immigrants | Eastern Europe | 70.4 /100 | #152 | Good 2.0% |
| Immigrants | Italy | 68.9 /100 | #153 | Good 2.0% |
| Immigrants | Venezuela | 68.5 /100 | #154 | Good 2.0% |