Dominican vs Immigrants from Denmark No Schooling Completed
COMPARE
Dominican
Immigrants from Denmark
No Schooling Completed
No Schooling Completed Comparison
Dominicans
Immigrants from Denmark
3.2%
NO SCHOOLING COMPLETED
0.0/ 100
METRIC RATING
325th/ 347
METRIC RANK
1.7%
NO SCHOOLING COMPLETED
99.2/ 100
METRIC RATING
84th/ 347
METRIC RANK
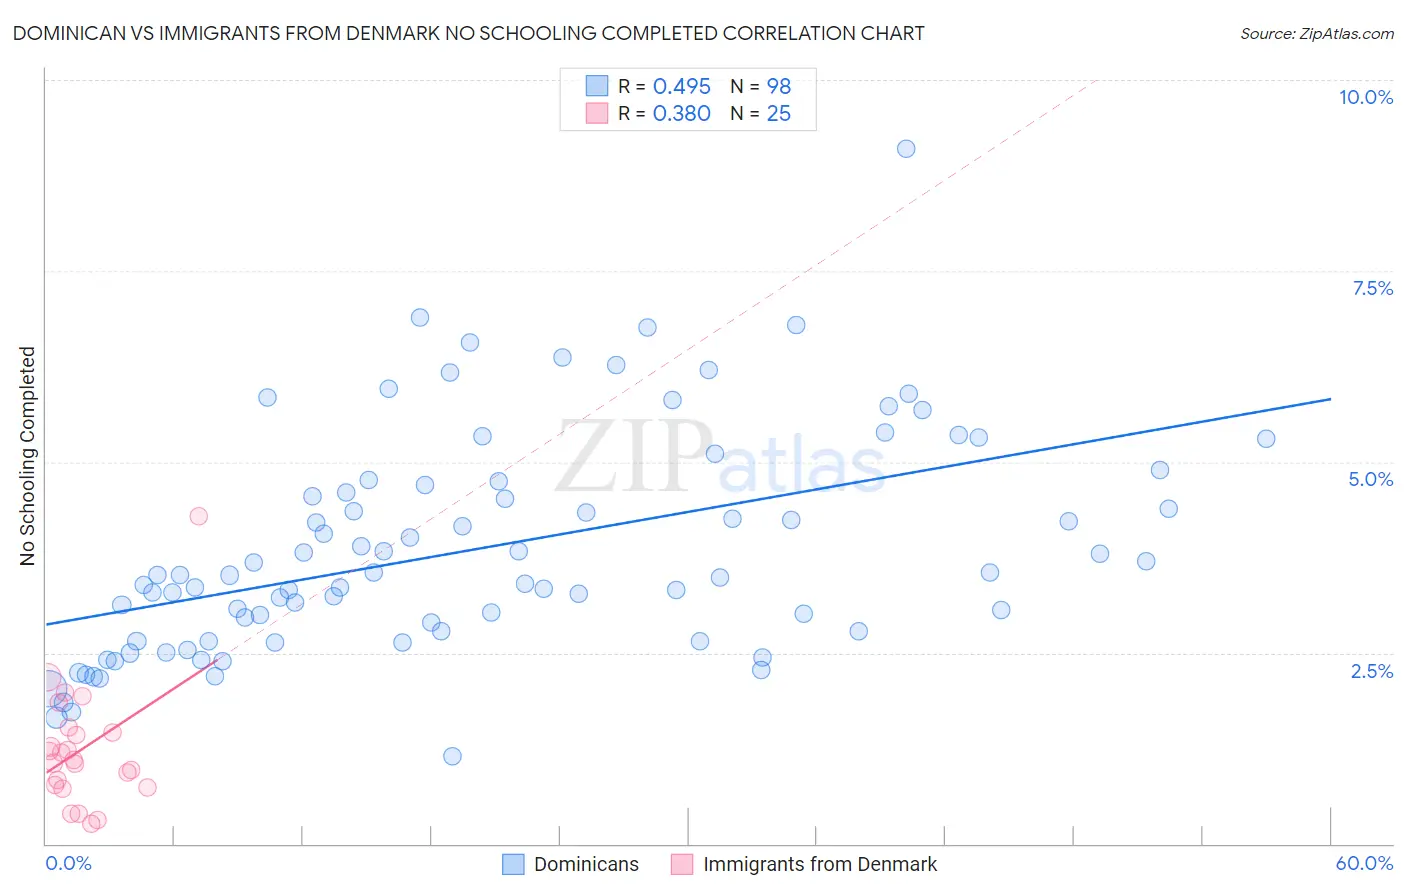
Dominican vs Immigrants from Denmark No Schooling Completed Correlation Chart
The statistical analysis conducted on geographies consisting of 352,198,650 people shows a moderate positive correlation between the proportion of Dominicans and percentage of population with no schooling in the United States with a correlation coefficient (R) of 0.495 and weighted average of 3.2%. Similarly, the statistical analysis conducted on geographies consisting of 135,590,094 people shows a mild positive correlation between the proportion of Immigrants from Denmark and percentage of population with no schooling in the United States with a correlation coefficient (R) of 0.380 and weighted average of 1.7%, a difference of 83.5%.
No Schooling Completed Correlation Summary
| Measurement | Dominican | Immigrants from Denmark |
| Minimum | 1.2% | 0.27% |
| Maximum | 9.1% | 4.3% |
| Range | 8.0% | 4.0% |
| Mean | 3.9% | 1.2% |
| Median | 3.5% | 1.1% |
| Interquartile 25% (IQ1) | 2.8% | 0.75% |
| Interquartile 75% (IQ3) | 4.7% | 1.5% |
| Interquartile Range (IQR) | 1.9% | 0.74% |
| Standard Deviation (Sample) | 1.4% | 0.82% |
| Standard Deviation (Population) | 1.4% | 0.80% |
Similar Demographics by No Schooling Completed
Demographics Similar to Dominicans by No Schooling Completed
In terms of no schooling completed, the demographic groups most similar to Dominicans are Indonesian (3.2%, a difference of 0.030%), Mexican American Indian (3.2%, a difference of 0.67%), Vietnamese (3.2%, a difference of 1.0%), Immigrants from Honduras (3.2%, a difference of 1.2%), and Immigrants from Laos (3.1%, a difference of 1.9%).
| Demographics | Rating | Rank | No Schooling Completed |
| Immigrants | Guyana | 0.0 /100 | #318 | Tragic 3.1% |
| Immigrants | Burma/Myanmar | 0.0 /100 | #319 | Tragic 3.1% |
| Immigrants | Bangladesh | 0.0 /100 | #320 | Tragic 3.1% |
| Immigrants | Laos | 0.0 /100 | #321 | Tragic 3.1% |
| Immigrants | Honduras | 0.0 /100 | #322 | Tragic 3.2% |
| Vietnamese | 0.0 /100 | #323 | Tragic 3.2% |
| Mexican American Indians | 0.0 /100 | #324 | Tragic 3.2% |
| Dominicans | 0.0 /100 | #325 | Tragic 3.2% |
| Indonesians | 0.0 /100 | #326 | Tragic 3.2% |
| Immigrants | Latin America | 0.0 /100 | #327 | Tragic 3.3% |
| Mexicans | 0.0 /100 | #328 | Tragic 3.3% |
| Immigrants | Vietnam | 0.0 /100 | #329 | Tragic 3.3% |
| Immigrants | Armenia | 0.0 /100 | #330 | Tragic 3.3% |
| Japanese | 0.0 /100 | #331 | Tragic 3.3% |
| Central Americans | 0.0 /100 | #332 | Tragic 3.4% |
Demographics Similar to Immigrants from Denmark by No Schooling Completed
In terms of no schooling completed, the demographic groups most similar to Immigrants from Denmark are Immigrants from Australia (1.7%, a difference of 0.040%), Potawatomi (1.7%, a difference of 0.050%), Ukrainian (1.8%, a difference of 0.090%), Immigrants from South Africa (1.7%, a difference of 0.16%), and Icelander (1.7%, a difference of 0.25%).
| Demographics | Rating | Rank | No Schooling Completed |
| Immigrants | Sweden | 99.3 /100 | #77 | Exceptional 1.7% |
| Delaware | 99.3 /100 | #78 | Exceptional 1.7% |
| Macedonians | 99.3 /100 | #79 | Exceptional 1.7% |
| Cypriots | 99.3 /100 | #80 | Exceptional 1.7% |
| Icelanders | 99.3 /100 | #81 | Exceptional 1.7% |
| Immigrants | South Africa | 99.3 /100 | #82 | Exceptional 1.7% |
| Potawatomi | 99.3 /100 | #83 | Exceptional 1.7% |
| Immigrants | Denmark | 99.2 /100 | #84 | Exceptional 1.7% |
| Immigrants | Australia | 99.2 /100 | #85 | Exceptional 1.7% |
| Ukrainians | 99.2 /100 | #86 | Exceptional 1.8% |
| Osage | 99.2 /100 | #87 | Exceptional 1.8% |
| Immigrants | Western Europe | 99.2 /100 | #88 | Exceptional 1.8% |
| South Africans | 99.1 /100 | #89 | Exceptional 1.8% |
| Sioux | 99.0 /100 | #90 | Exceptional 1.8% |
| Immigrants | Germany | 99.0 /100 | #91 | Exceptional 1.8% |