Dominican vs Immigrants from Romania No Schooling Completed
COMPARE
Dominican
Immigrants from Romania
No Schooling Completed
No Schooling Completed Comparison
Dominicans
Immigrants from Romania
3.2%
NO SCHOOLING COMPLETED
0.0/ 100
METRIC RATING
325th/ 347
METRIC RANK
1.9%
NO SCHOOLING COMPLETED
92.6/ 100
METRIC RATING
126th/ 347
METRIC RANK
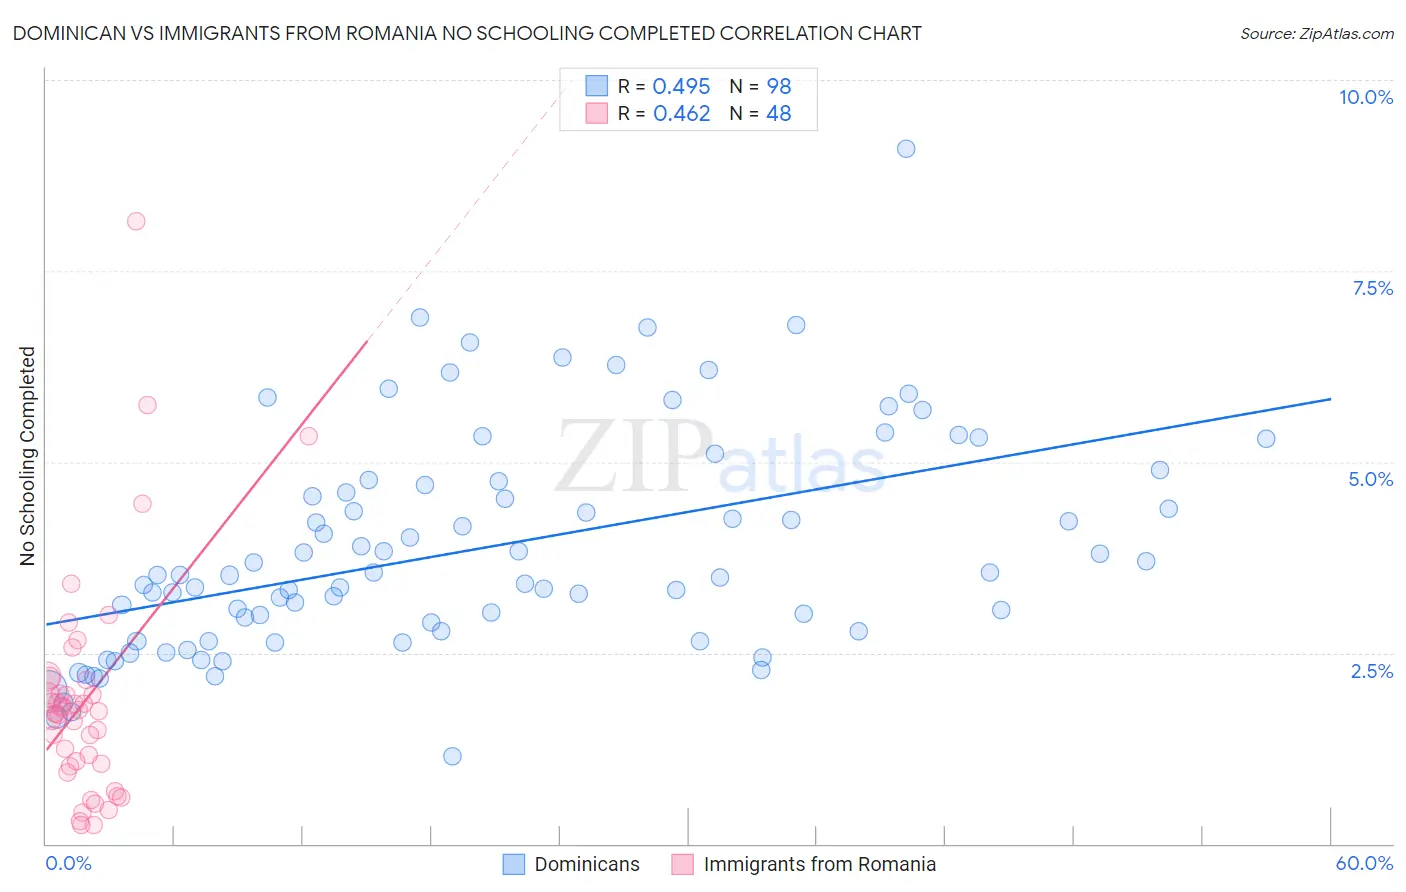
Dominican vs Immigrants from Romania No Schooling Completed Correlation Chart
The statistical analysis conducted on geographies consisting of 352,198,650 people shows a moderate positive correlation between the proportion of Dominicans and percentage of population with no schooling in the United States with a correlation coefficient (R) of 0.495 and weighted average of 3.2%. Similarly, the statistical analysis conducted on geographies consisting of 255,626,643 people shows a moderate positive correlation between the proportion of Immigrants from Romania and percentage of population with no schooling in the United States with a correlation coefficient (R) of 0.462 and weighted average of 1.9%, a difference of 67.6%.
No Schooling Completed Correlation Summary
| Measurement | Dominican | Immigrants from Romania |
| Minimum | 1.2% | 0.24% |
| Maximum | 9.1% | 8.2% |
| Range | 8.0% | 7.9% |
| Mean | 3.9% | 1.9% |
| Median | 3.5% | 1.7% |
| Interquartile 25% (IQ1) | 2.8% | 1.0% |
| Interquartile 75% (IQ3) | 4.7% | 2.1% |
| Interquartile Range (IQR) | 1.9% | 1.0% |
| Standard Deviation (Sample) | 1.4% | 1.5% |
| Standard Deviation (Population) | 1.4% | 1.5% |
Similar Demographics by No Schooling Completed
Demographics Similar to Dominicans by No Schooling Completed
In terms of no schooling completed, the demographic groups most similar to Dominicans are Indonesian (3.2%, a difference of 0.030%), Mexican American Indian (3.2%, a difference of 0.67%), Vietnamese (3.2%, a difference of 1.0%), Immigrants from Honduras (3.2%, a difference of 1.2%), and Immigrants from Laos (3.1%, a difference of 1.9%).
| Demographics | Rating | Rank | No Schooling Completed |
| Immigrants | Guyana | 0.0 /100 | #318 | Tragic 3.1% |
| Immigrants | Burma/Myanmar | 0.0 /100 | #319 | Tragic 3.1% |
| Immigrants | Bangladesh | 0.0 /100 | #320 | Tragic 3.1% |
| Immigrants | Laos | 0.0 /100 | #321 | Tragic 3.1% |
| Immigrants | Honduras | 0.0 /100 | #322 | Tragic 3.2% |
| Vietnamese | 0.0 /100 | #323 | Tragic 3.2% |
| Mexican American Indians | 0.0 /100 | #324 | Tragic 3.2% |
| Dominicans | 0.0 /100 | #325 | Tragic 3.2% |
| Indonesians | 0.0 /100 | #326 | Tragic 3.2% |
| Immigrants | Latin America | 0.0 /100 | #327 | Tragic 3.3% |
| Mexicans | 0.0 /100 | #328 | Tragic 3.3% |
| Immigrants | Vietnam | 0.0 /100 | #329 | Tragic 3.3% |
| Immigrants | Armenia | 0.0 /100 | #330 | Tragic 3.3% |
| Japanese | 0.0 /100 | #331 | Tragic 3.3% |
| Central Americans | 0.0 /100 | #332 | Tragic 3.4% |
Demographics Similar to Immigrants from Romania by No Schooling Completed
In terms of no schooling completed, the demographic groups most similar to Immigrants from Romania are Israeli (1.9%, a difference of 0.060%), Spaniard (1.9%, a difference of 0.15%), Seminole (1.9%, a difference of 0.29%), Palestinian (1.9%, a difference of 0.40%), and Immigrants from Hungary (1.9%, a difference of 0.51%).
| Demographics | Rating | Rank | No Schooling Completed |
| Iroquois | 95.1 /100 | #119 | Exceptional 1.9% |
| Immigrants | Bulgaria | 94.6 /100 | #120 | Exceptional 1.9% |
| Immigrants | Croatia | 94.5 /100 | #121 | Exceptional 1.9% |
| Cree | 94.5 /100 | #122 | Exceptional 1.9% |
| Immigrants | Kuwait | 93.9 /100 | #123 | Exceptional 1.9% |
| Cambodians | 93.8 /100 | #124 | Exceptional 1.9% |
| Immigrants | Europe | 93.7 /100 | #125 | Exceptional 1.9% |
| Immigrants | Romania | 92.6 /100 | #126 | Exceptional 1.9% |
| Israelis | 92.4 /100 | #127 | Exceptional 1.9% |
| Spaniards | 92.3 /100 | #128 | Exceptional 1.9% |
| Seminole | 92.0 /100 | #129 | Exceptional 1.9% |
| Palestinians | 91.8 /100 | #130 | Exceptional 1.9% |
| Immigrants | Hungary | 91.6 /100 | #131 | Exceptional 1.9% |
| Colville | 90.4 /100 | #132 | Exceptional 1.9% |
| Immigrants | Turkey | 90.2 /100 | #133 | Exceptional 1.9% |