Houma vs Soviet Union No Schooling Completed
COMPARE
Houma
Soviet Union
No Schooling Completed
No Schooling Completed Comparison
Houma
Soviet Union
2.8%
NO SCHOOLING COMPLETED
0.0/ 100
METRIC RATING
295th/ 347
METRIC RANK
2.0%
NO SCHOOLING COMPLETED
77.1/ 100
METRIC RATING
147th/ 347
METRIC RANK
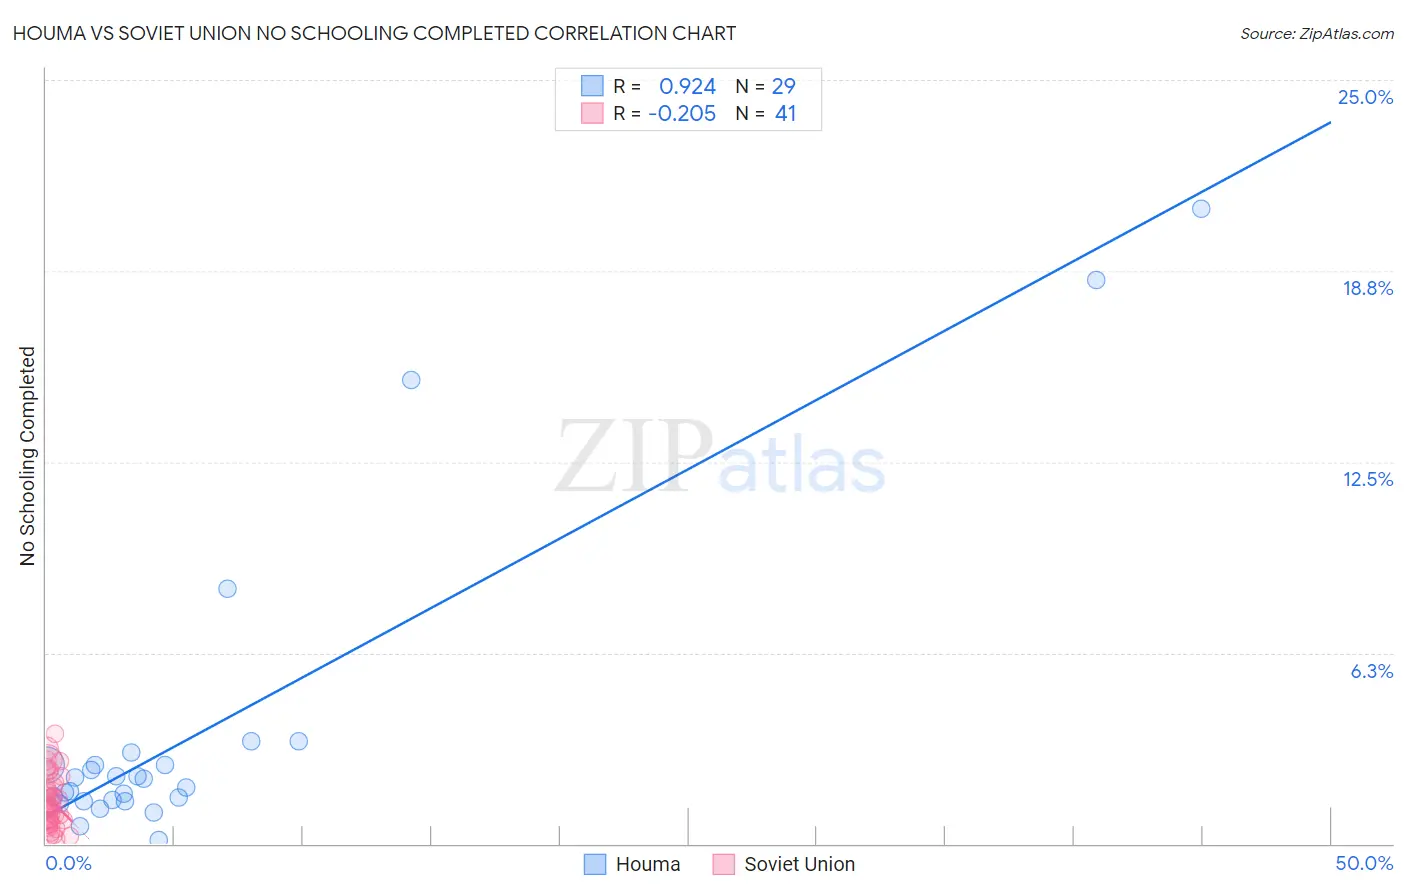
Houma vs Soviet Union No Schooling Completed Correlation Chart
The statistical analysis conducted on geographies consisting of 36,712,306 people shows a near-perfect positive correlation between the proportion of Houma and percentage of population with no schooling in the United States with a correlation coefficient (R) of 0.924 and weighted average of 2.8%. Similarly, the statistical analysis conducted on geographies consisting of 43,404,550 people shows a weak negative correlation between the proportion of Soviet Union and percentage of population with no schooling in the United States with a correlation coefficient (R) of -0.205 and weighted average of 2.0%, a difference of 38.9%.
No Schooling Completed Correlation Summary
| Measurement | Houma | Soviet Union |
| Minimum | 0.12% | 0.17% |
| Maximum | 20.8% | 3.6% |
| Range | 20.7% | 3.4% |
| Mean | 3.8% | 1.4% |
| Median | 2.1% | 1.2% |
| Interquartile 25% (IQ1) | 1.4% | 0.75% |
| Interquartile 75% (IQ3) | 2.8% | 1.9% |
| Interquartile Range (IQR) | 1.4% | 1.2% |
| Standard Deviation (Sample) | 5.2% | 0.87% |
| Standard Deviation (Population) | 5.1% | 0.86% |
Similar Demographics by No Schooling Completed
Demographics Similar to Houma by No Schooling Completed
In terms of no schooling completed, the demographic groups most similar to Houma are Immigrants (2.8%, a difference of 0.10%), Immigrants from Eritrea (2.8%, a difference of 0.52%), Malaysian (2.8%, a difference of 0.69%), Immigrants from Grenada (2.8%, a difference of 1.1%), and Immigrants from Cuba (2.8%, a difference of 1.3%).
| Demographics | Rating | Rank | No Schooling Completed |
| Immigrants | St. Vincent and the Grenadines | 0.0 /100 | #288 | Tragic 2.7% |
| Immigrants | Thailand | 0.0 /100 | #289 | Tragic 2.7% |
| Immigrants | Hong Kong | 0.0 /100 | #290 | Tragic 2.7% |
| British West Indians | 0.0 /100 | #291 | Tragic 2.7% |
| Immigrants | Grenada | 0.0 /100 | #292 | Tragic 2.8% |
| Malaysians | 0.0 /100 | #293 | Tragic 2.8% |
| Immigrants | Eritrea | 0.0 /100 | #294 | Tragic 2.8% |
| Houma | 0.0 /100 | #295 | Tragic 2.8% |
| Immigrants | Immigrants | 0.0 /100 | #296 | Tragic 2.8% |
| Immigrants | Cuba | 0.0 /100 | #297 | Tragic 2.8% |
| Immigrants | Dominica | 0.0 /100 | #298 | Tragic 2.8% |
| Central American Indians | 0.0 /100 | #299 | Tragic 2.8% |
| Haitians | 0.0 /100 | #300 | Tragic 2.9% |
| Immigrants | South Eastern Asia | 0.0 /100 | #301 | Tragic 2.9% |
| Immigrants | Caribbean | 0.0 /100 | #302 | Tragic 2.9% |
Demographics Similar to Soviet Union by No Schooling Completed
In terms of no schooling completed, the demographic groups most similar to Soviet Union are Shoshone (2.0%, a difference of 0.080%), Immigrants from Moldova (2.0%, a difference of 0.17%), Immigrants from North Macedonia (2.0%, a difference of 0.24%), Immigrants from Iran (2.0%, a difference of 0.39%), and Alsatian (2.0%, a difference of 0.40%).
| Demographics | Rating | Rank | No Schooling Completed |
| Marshallese | 83.5 /100 | #140 | Excellent 2.0% |
| Immigrants | Greece | 83.5 /100 | #141 | Excellent 2.0% |
| Venezuelans | 81.5 /100 | #142 | Excellent 2.0% |
| Immigrants | South Central Asia | 80.0 /100 | #143 | Good 2.0% |
| Alsatians | 79.1 /100 | #144 | Good 2.0% |
| Immigrants | Iran | 79.0 /100 | #145 | Good 2.0% |
| Immigrants | Moldova | 78.0 /100 | #146 | Good 2.0% |
| Soviet Union | 77.1 /100 | #147 | Good 2.0% |
| Shoshone | 76.7 /100 | #148 | Good 2.0% |
| Immigrants | North Macedonia | 75.9 /100 | #149 | Good 2.0% |
| Blackfeet | 72.9 /100 | #150 | Good 2.0% |
| Immigrants | Jordan | 70.9 /100 | #151 | Good 2.0% |
| Immigrants | Eastern Europe | 70.4 /100 | #152 | Good 2.0% |
| Immigrants | Italy | 68.9 /100 | #153 | Good 2.0% |
| Immigrants | Venezuela | 68.5 /100 | #154 | Good 2.0% |