Central American Indian vs Soviet Union No Schooling Completed
COMPARE
Central American Indian
Soviet Union
No Schooling Completed
No Schooling Completed Comparison
Central American Indians
Soviet Union
2.8%
NO SCHOOLING COMPLETED
0.0/ 100
METRIC RATING
299th/ 347
METRIC RANK
2.0%
NO SCHOOLING COMPLETED
77.1/ 100
METRIC RATING
147th/ 347
METRIC RANK
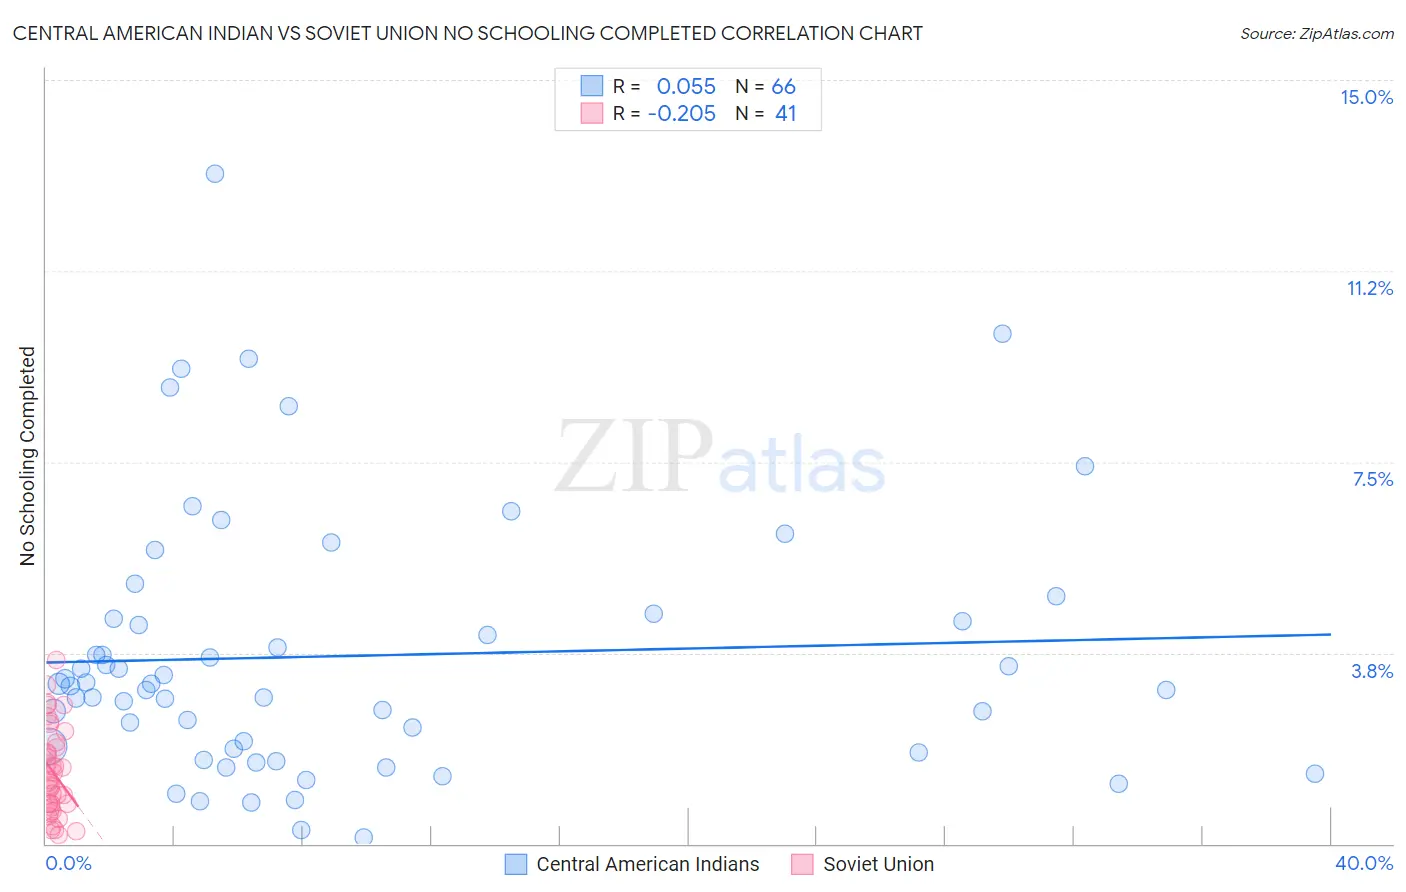
Central American Indian vs Soviet Union No Schooling Completed Correlation Chart
The statistical analysis conducted on geographies consisting of 324,704,734 people shows a slight positive correlation between the proportion of Central American Indians and percentage of population with no schooling in the United States with a correlation coefficient (R) of 0.055 and weighted average of 2.8%. Similarly, the statistical analysis conducted on geographies consisting of 43,404,550 people shows a weak negative correlation between the proportion of Soviet Union and percentage of population with no schooling in the United States with a correlation coefficient (R) of -0.205 and weighted average of 2.0%, a difference of 41.8%.
No Schooling Completed Correlation Summary
| Measurement | Central American Indian | Soviet Union |
| Minimum | 0.13% | 0.17% |
| Maximum | 13.2% | 3.6% |
| Range | 13.0% | 3.4% |
| Mean | 3.7% | 1.4% |
| Median | 3.1% | 1.2% |
| Interquartile 25% (IQ1) | 1.9% | 0.75% |
| Interquartile 75% (IQ3) | 4.4% | 1.9% |
| Interquartile Range (IQR) | 2.5% | 1.2% |
| Standard Deviation (Sample) | 2.6% | 0.87% |
| Standard Deviation (Population) | 2.6% | 0.86% |
Similar Demographics by No Schooling Completed
Demographics Similar to Central American Indians by No Schooling Completed
In terms of no schooling completed, the demographic groups most similar to Central American Indians are Haitian (2.9%, a difference of 0.31%), Immigrants from Dominica (2.8%, a difference of 0.51%), Immigrants from Cuba (2.8%, a difference of 0.84%), Immigrants from South Eastern Asia (2.9%, a difference of 1.8%), and Immigrants (2.8%, a difference of 2.0%).
| Demographics | Rating | Rank | No Schooling Completed |
| Immigrants | Grenada | 0.0 /100 | #292 | Tragic 2.8% |
| Malaysians | 0.0 /100 | #293 | Tragic 2.8% |
| Immigrants | Eritrea | 0.0 /100 | #294 | Tragic 2.8% |
| Houma | 0.0 /100 | #295 | Tragic 2.8% |
| Immigrants | Immigrants | 0.0 /100 | #296 | Tragic 2.8% |
| Immigrants | Cuba | 0.0 /100 | #297 | Tragic 2.8% |
| Immigrants | Dominica | 0.0 /100 | #298 | Tragic 2.8% |
| Central American Indians | 0.0 /100 | #299 | Tragic 2.8% |
| Haitians | 0.0 /100 | #300 | Tragic 2.9% |
| Immigrants | South Eastern Asia | 0.0 /100 | #301 | Tragic 2.9% |
| Immigrants | Caribbean | 0.0 /100 | #302 | Tragic 2.9% |
| Somalis | 0.0 /100 | #303 | Tragic 2.9% |
| Nicaraguans | 0.0 /100 | #304 | Tragic 2.9% |
| Ecuadorians | 0.0 /100 | #305 | Tragic 3.0% |
| Belizeans | 0.0 /100 | #306 | Tragic 3.0% |
Demographics Similar to Soviet Union by No Schooling Completed
In terms of no schooling completed, the demographic groups most similar to Soviet Union are Shoshone (2.0%, a difference of 0.080%), Immigrants from Moldova (2.0%, a difference of 0.17%), Immigrants from North Macedonia (2.0%, a difference of 0.24%), Immigrants from Iran (2.0%, a difference of 0.39%), and Alsatian (2.0%, a difference of 0.40%).
| Demographics | Rating | Rank | No Schooling Completed |
| Marshallese | 83.5 /100 | #140 | Excellent 2.0% |
| Immigrants | Greece | 83.5 /100 | #141 | Excellent 2.0% |
| Venezuelans | 81.5 /100 | #142 | Excellent 2.0% |
| Immigrants | South Central Asia | 80.0 /100 | #143 | Good 2.0% |
| Alsatians | 79.1 /100 | #144 | Good 2.0% |
| Immigrants | Iran | 79.0 /100 | #145 | Good 2.0% |
| Immigrants | Moldova | 78.0 /100 | #146 | Good 2.0% |
| Soviet Union | 77.1 /100 | #147 | Good 2.0% |
| Shoshone | 76.7 /100 | #148 | Good 2.0% |
| Immigrants | North Macedonia | 75.9 /100 | #149 | Good 2.0% |
| Blackfeet | 72.9 /100 | #150 | Good 2.0% |
| Immigrants | Jordan | 70.9 /100 | #151 | Good 2.0% |
| Immigrants | Eastern Europe | 70.4 /100 | #152 | Good 2.0% |
| Immigrants | Italy | 68.9 /100 | #153 | Good 2.0% |
| Immigrants | Venezuela | 68.5 /100 | #154 | Good 2.0% |