Dominican vs Guyanese No Schooling Completed
COMPARE
Dominican
Guyanese
No Schooling Completed
No Schooling Completed Comparison
Dominicans
Guyanese
3.2%
NO SCHOOLING COMPLETED
0.0/ 100
METRIC RATING
325th/ 347
METRIC RANK
3.0%
NO SCHOOLING COMPLETED
0.0/ 100
METRIC RATING
310th/ 347
METRIC RANK
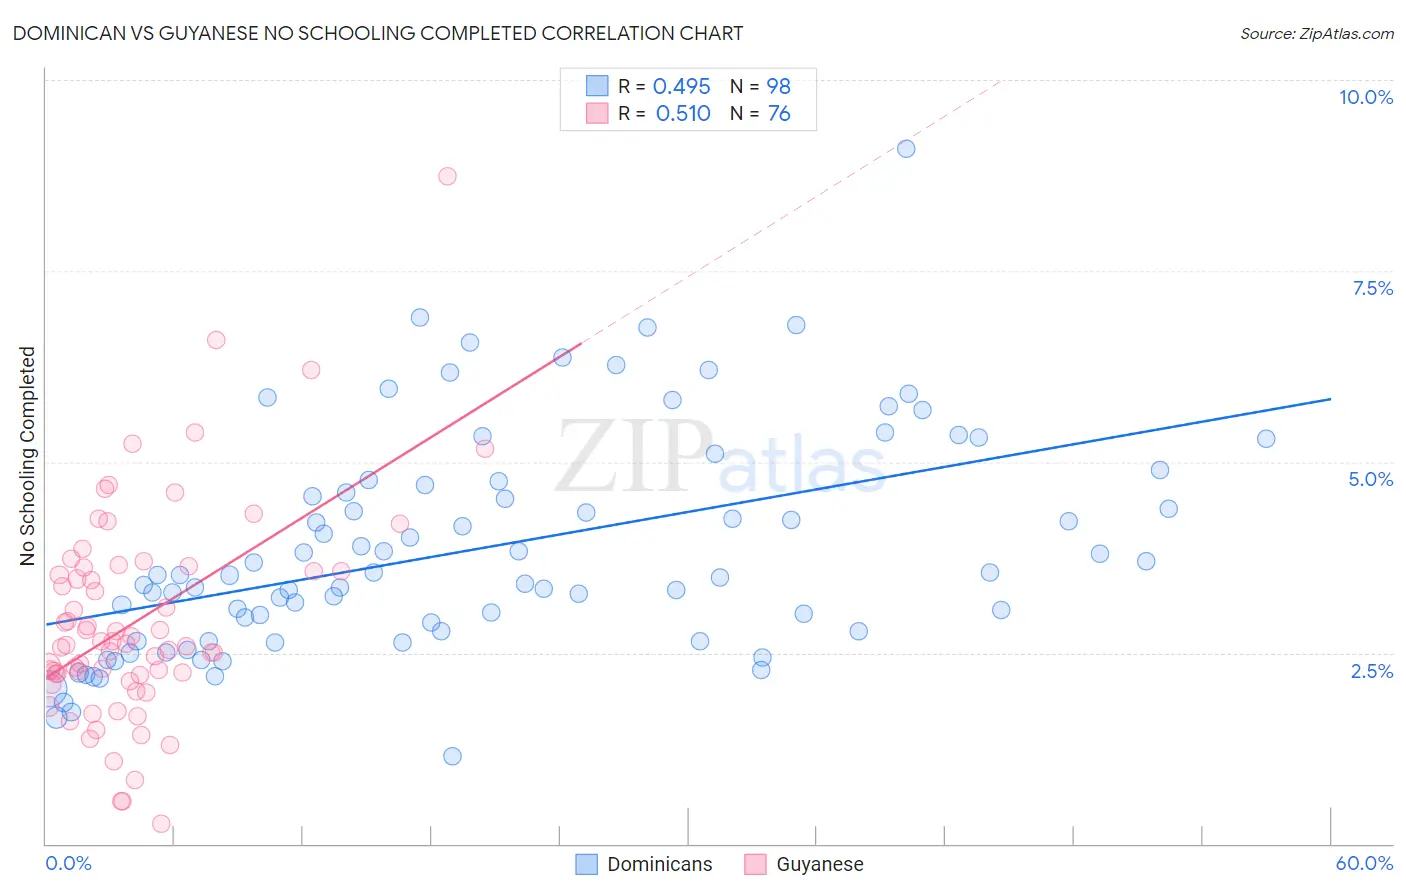
Dominican vs Guyanese No Schooling Completed Correlation Chart
The statistical analysis conducted on geographies consisting of 352,198,650 people shows a moderate positive correlation between the proportion of Dominicans and percentage of population with no schooling in the United States with a correlation coefficient (R) of 0.495 and weighted average of 3.2%. Similarly, the statistical analysis conducted on geographies consisting of 176,268,002 people shows a substantial positive correlation between the proportion of Guyanese and percentage of population with no schooling in the United States with a correlation coefficient (R) of 0.510 and weighted average of 3.0%, a difference of 5.7%.
No Schooling Completed Correlation Summary
| Measurement | Dominican | Guyanese |
| Minimum | 1.2% | 0.26% |
| Maximum | 9.1% | 8.7% |
| Range | 8.0% | 8.5% |
| Mean | 3.9% | 2.9% |
| Median | 3.5% | 2.6% |
| Interquartile 25% (IQ1) | 2.8% | 2.2% |
| Interquartile 75% (IQ3) | 4.7% | 3.6% |
| Interquartile Range (IQR) | 1.9% | 1.4% |
| Standard Deviation (Sample) | 1.4% | 1.4% |
| Standard Deviation (Population) | 1.4% | 1.4% |
Demographics Similar to Dominicans and Guyanese by No Schooling Completed
In terms of no schooling completed, the demographic groups most similar to Dominicans are Indonesian (3.2%, a difference of 0.030%), Mexican American Indian (3.2%, a difference of 0.67%), Vietnamese (3.2%, a difference of 1.0%), Immigrants from Honduras (3.2%, a difference of 1.2%), and Immigrants from Laos (3.1%, a difference of 1.9%). Similarly, the demographic groups most similar to Guyanese are Hispanic or Latino (3.0%, a difference of 0.050%), Immigrants from the Azores (3.0%, a difference of 0.10%), Sri Lankan (3.0%, a difference of 0.38%), Immigrants from Somalia (3.0%, a difference of 0.86%), and Honduran (3.1%, a difference of 0.89%).
| Demographics | Rating | Rank | No Schooling Completed |
| Immigrants | Haiti | 0.0 /100 | #307 | Tragic 3.0% |
| Immigrants | Somalia | 0.0 /100 | #308 | Tragic 3.0% |
| Hispanics or Latinos | 0.0 /100 | #309 | Tragic 3.0% |
| Guyanese | 0.0 /100 | #310 | Tragic 3.0% |
| Immigrants | Azores | 0.0 /100 | #311 | Tragic 3.0% |
| Sri Lankans | 0.0 /100 | #312 | Tragic 3.0% |
| Hondurans | 0.0 /100 | #313 | Tragic 3.1% |
| Immigrants | Belize | 0.0 /100 | #314 | Tragic 3.1% |
| Immigrants | Nicaragua | 0.0 /100 | #315 | Tragic 3.1% |
| Immigrants | Ecuador | 0.0 /100 | #316 | Tragic 3.1% |
| Cape Verdeans | 0.0 /100 | #317 | Tragic 3.1% |
| Immigrants | Guyana | 0.0 /100 | #318 | Tragic 3.1% |
| Immigrants | Burma/Myanmar | 0.0 /100 | #319 | Tragic 3.1% |
| Immigrants | Bangladesh | 0.0 /100 | #320 | Tragic 3.1% |
| Immigrants | Laos | 0.0 /100 | #321 | Tragic 3.1% |
| Immigrants | Honduras | 0.0 /100 | #322 | Tragic 3.2% |
| Vietnamese | 0.0 /100 | #323 | Tragic 3.2% |
| Mexican American Indians | 0.0 /100 | #324 | Tragic 3.2% |
| Dominicans | 0.0 /100 | #325 | Tragic 3.2% |
| Indonesians | 0.0 /100 | #326 | Tragic 3.2% |
| Immigrants | Latin America | 0.0 /100 | #327 | Tragic 3.3% |