Dominican vs Immigrants from Portugal No Schooling Completed
COMPARE
Dominican
Immigrants from Portugal
No Schooling Completed
No Schooling Completed Comparison
Dominicans
Immigrants from Portugal
3.2%
NO SCHOOLING COMPLETED
0.0/ 100
METRIC RATING
325th/ 347
METRIC RANK
2.7%
NO SCHOOLING COMPLETED
0.0/ 100
METRIC RATING
286th/ 347
METRIC RANK
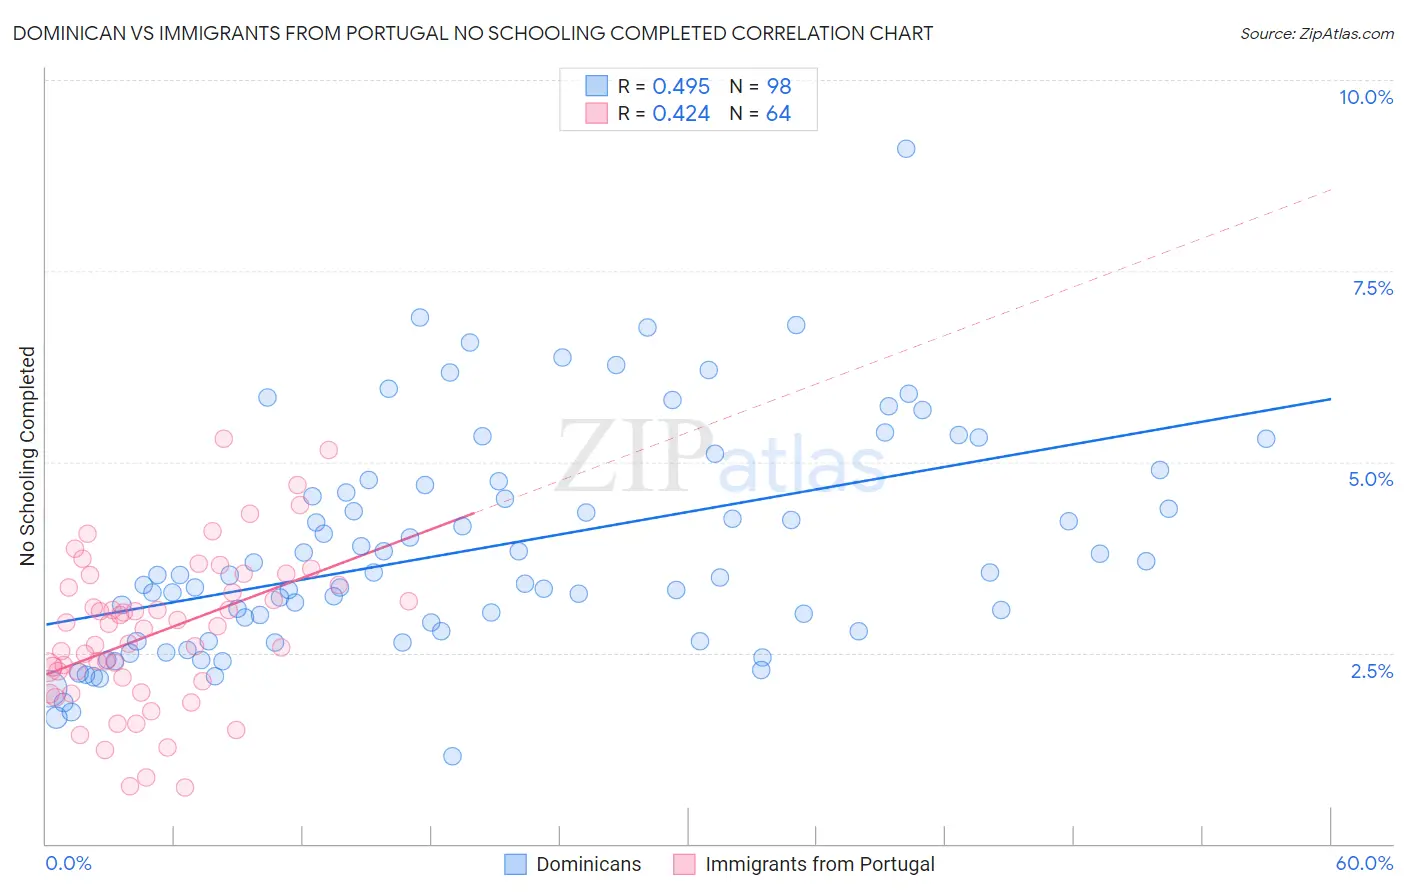
Dominican vs Immigrants from Portugal No Schooling Completed Correlation Chart
The statistical analysis conducted on geographies consisting of 352,198,650 people shows a moderate positive correlation between the proportion of Dominicans and percentage of population with no schooling in the United States with a correlation coefficient (R) of 0.495 and weighted average of 3.2%. Similarly, the statistical analysis conducted on geographies consisting of 174,032,123 people shows a moderate positive correlation between the proportion of Immigrants from Portugal and percentage of population with no schooling in the United States with a correlation coefficient (R) of 0.424 and weighted average of 2.7%, a difference of 20.2%.
No Schooling Completed Correlation Summary
| Measurement | Dominican | Immigrants from Portugal |
| Minimum | 1.2% | 0.74% |
| Maximum | 9.1% | 5.3% |
| Range | 8.0% | 4.6% |
| Mean | 3.9% | 2.8% |
| Median | 3.5% | 2.8% |
| Interquartile 25% (IQ1) | 2.8% | 2.1% |
| Interquartile 75% (IQ3) | 4.7% | 3.4% |
| Interquartile Range (IQR) | 1.9% | 1.2% |
| Standard Deviation (Sample) | 1.4% | 1.00% |
| Standard Deviation (Population) | 1.4% | 0.99% |
Similar Demographics by No Schooling Completed
Demographics Similar to Dominicans by No Schooling Completed
In terms of no schooling completed, the demographic groups most similar to Dominicans are Indonesian (3.2%, a difference of 0.030%), Mexican American Indian (3.2%, a difference of 0.67%), Vietnamese (3.2%, a difference of 1.0%), Immigrants from Honduras (3.2%, a difference of 1.2%), and Immigrants from Laos (3.1%, a difference of 1.9%).
| Demographics | Rating | Rank | No Schooling Completed |
| Immigrants | Guyana | 0.0 /100 | #318 | Tragic 3.1% |
| Immigrants | Burma/Myanmar | 0.0 /100 | #319 | Tragic 3.1% |
| Immigrants | Bangladesh | 0.0 /100 | #320 | Tragic 3.1% |
| Immigrants | Laos | 0.0 /100 | #321 | Tragic 3.1% |
| Immigrants | Honduras | 0.0 /100 | #322 | Tragic 3.2% |
| Vietnamese | 0.0 /100 | #323 | Tragic 3.2% |
| Mexican American Indians | 0.0 /100 | #324 | Tragic 3.2% |
| Dominicans | 0.0 /100 | #325 | Tragic 3.2% |
| Indonesians | 0.0 /100 | #326 | Tragic 3.2% |
| Immigrants | Latin America | 0.0 /100 | #327 | Tragic 3.3% |
| Mexicans | 0.0 /100 | #328 | Tragic 3.3% |
| Immigrants | Vietnam | 0.0 /100 | #329 | Tragic 3.3% |
| Immigrants | Armenia | 0.0 /100 | #330 | Tragic 3.3% |
| Japanese | 0.0 /100 | #331 | Tragic 3.3% |
| Central Americans | 0.0 /100 | #332 | Tragic 3.4% |
Demographics Similar to Immigrants from Portugal by No Schooling Completed
In terms of no schooling completed, the demographic groups most similar to Immigrants from Portugal are Immigrants from Barbados (2.7%, a difference of 0.42%), Immigrants from West Indies (2.7%, a difference of 0.49%), Immigrants from Afghanistan (2.7%, a difference of 0.81%), Immigrants from St. Vincent and the Grenadines (2.7%, a difference of 0.91%), and Immigrants from Trinidad and Tobago (2.6%, a difference of 1.2%).
| Demographics | Rating | Rank | No Schooling Completed |
| Barbadians | 0.1 /100 | #279 | Tragic 2.6% |
| Trinidadians and Tobagonians | 0.1 /100 | #280 | Tragic 2.6% |
| Afghans | 0.1 /100 | #281 | Tragic 2.6% |
| Immigrants | Ghana | 0.1 /100 | #282 | Tragic 2.6% |
| Immigrants | Trinidad and Tobago | 0.0 /100 | #283 | Tragic 2.6% |
| Immigrants | West Indies | 0.0 /100 | #284 | Tragic 2.7% |
| Immigrants | Barbados | 0.0 /100 | #285 | Tragic 2.7% |
| Immigrants | Portugal | 0.0 /100 | #286 | Tragic 2.7% |
| Immigrants | Afghanistan | 0.0 /100 | #287 | Tragic 2.7% |
| Immigrants | St. Vincent and the Grenadines | 0.0 /100 | #288 | Tragic 2.7% |
| Immigrants | Thailand | 0.0 /100 | #289 | Tragic 2.7% |
| Immigrants | Hong Kong | 0.0 /100 | #290 | Tragic 2.7% |
| British West Indians | 0.0 /100 | #291 | Tragic 2.7% |
| Immigrants | Grenada | 0.0 /100 | #292 | Tragic 2.8% |
| Malaysians | 0.0 /100 | #293 | Tragic 2.8% |