Dominican vs Okinawan No Schooling Completed
COMPARE
Dominican
Okinawan
No Schooling Completed
No Schooling Completed Comparison
Dominicans
Okinawans
3.2%
NO SCHOOLING COMPLETED
0.0/ 100
METRIC RATING
325th/ 347
METRIC RANK
1.8%
NO SCHOOLING COMPLETED
97.1/ 100
METRIC RATING
108th/ 347
METRIC RANK
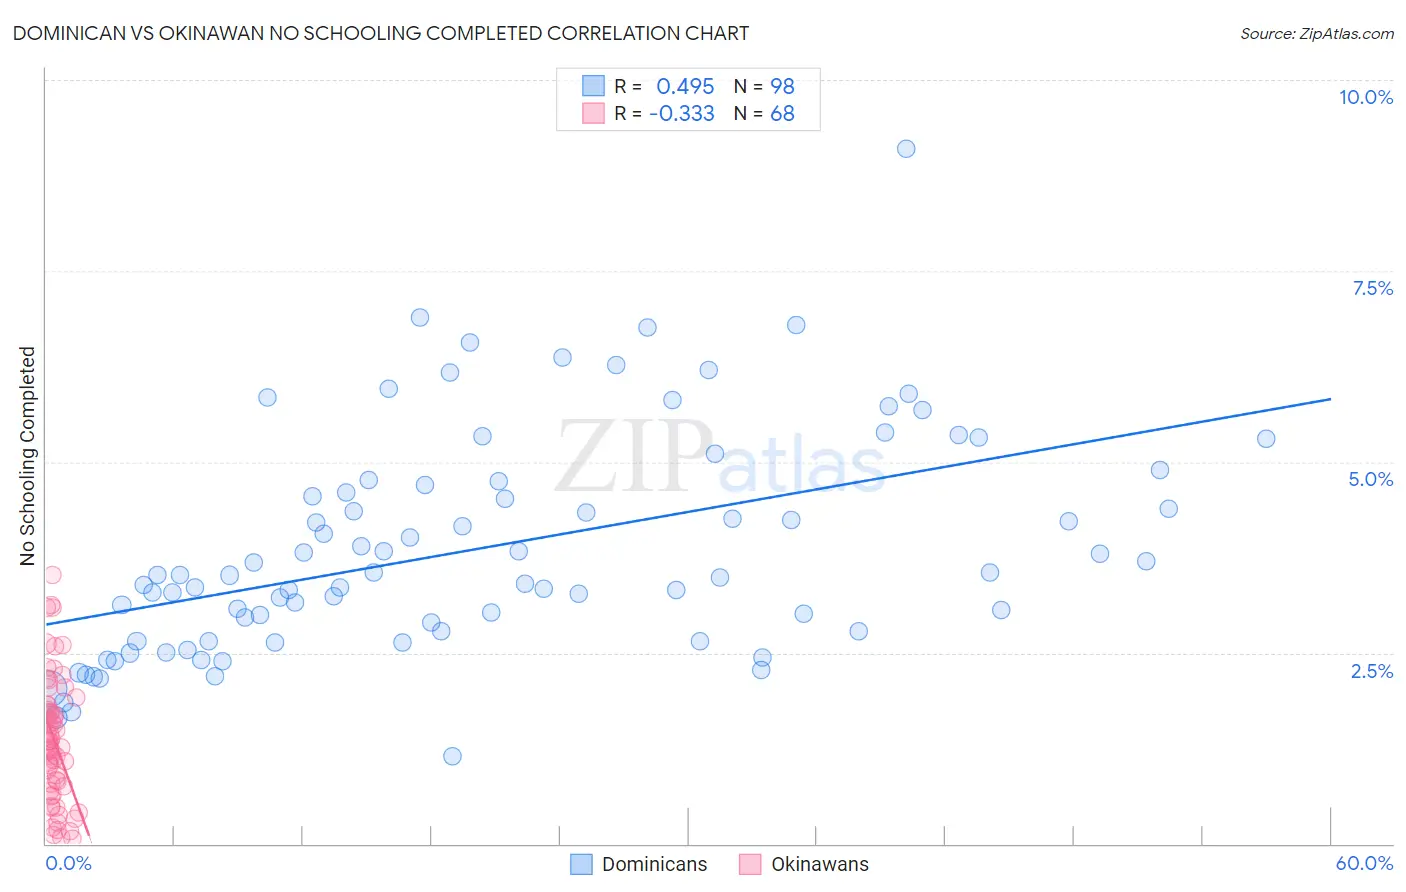
Dominican vs Okinawan No Schooling Completed Correlation Chart
The statistical analysis conducted on geographies consisting of 352,198,650 people shows a moderate positive correlation between the proportion of Dominicans and percentage of population with no schooling in the United States with a correlation coefficient (R) of 0.495 and weighted average of 3.2%. Similarly, the statistical analysis conducted on geographies consisting of 73,597,304 people shows a mild negative correlation between the proportion of Okinawans and percentage of population with no schooling in the United States with a correlation coefficient (R) of -0.333 and weighted average of 1.8%, a difference of 73.9%.
No Schooling Completed Correlation Summary
| Measurement | Dominican | Okinawan |
| Minimum | 1.2% | 0.067% |
| Maximum | 9.1% | 3.5% |
| Range | 8.0% | 3.5% |
| Mean | 3.9% | 1.4% |
| Median | 3.5% | 1.3% |
| Interquartile 25% (IQ1) | 2.8% | 0.77% |
| Interquartile 75% (IQ3) | 4.7% | 1.8% |
| Interquartile Range (IQR) | 1.9% | 1.0% |
| Standard Deviation (Sample) | 1.4% | 0.81% |
| Standard Deviation (Population) | 1.4% | 0.80% |
Similar Demographics by No Schooling Completed
Demographics Similar to Dominicans by No Schooling Completed
In terms of no schooling completed, the demographic groups most similar to Dominicans are Indonesian (3.2%, a difference of 0.030%), Mexican American Indian (3.2%, a difference of 0.67%), Vietnamese (3.2%, a difference of 1.0%), Immigrants from Honduras (3.2%, a difference of 1.2%), and Immigrants from Laos (3.1%, a difference of 1.9%).
| Demographics | Rating | Rank | No Schooling Completed |
| Immigrants | Guyana | 0.0 /100 | #318 | Tragic 3.1% |
| Immigrants | Burma/Myanmar | 0.0 /100 | #319 | Tragic 3.1% |
| Immigrants | Bangladesh | 0.0 /100 | #320 | Tragic 3.1% |
| Immigrants | Laos | 0.0 /100 | #321 | Tragic 3.1% |
| Immigrants | Honduras | 0.0 /100 | #322 | Tragic 3.2% |
| Vietnamese | 0.0 /100 | #323 | Tragic 3.2% |
| Mexican American Indians | 0.0 /100 | #324 | Tragic 3.2% |
| Dominicans | 0.0 /100 | #325 | Tragic 3.2% |
| Indonesians | 0.0 /100 | #326 | Tragic 3.2% |
| Immigrants | Latin America | 0.0 /100 | #327 | Tragic 3.3% |
| Mexicans | 0.0 /100 | #328 | Tragic 3.3% |
| Immigrants | Vietnam | 0.0 /100 | #329 | Tragic 3.3% |
| Immigrants | Armenia | 0.0 /100 | #330 | Tragic 3.3% |
| Japanese | 0.0 /100 | #331 | Tragic 3.3% |
| Central Americans | 0.0 /100 | #332 | Tragic 3.4% |
Demographics Similar to Okinawans by No Schooling Completed
In terms of no schooling completed, the demographic groups most similar to Okinawans are Yugoslavian (1.8%, a difference of 0.22%), Immigrants from France (1.8%, a difference of 0.26%), Immigrants from Saudi Arabia (1.9%, a difference of 0.35%), Immigrants from Latvia (1.9%, a difference of 0.48%), and Immigrants from Japan (1.9%, a difference of 0.63%).
| Demographics | Rating | Rank | No Schooling Completed |
| Immigrants | Czechoslovakia | 97.9 /100 | #101 | Exceptional 1.8% |
| Immigrants | Switzerland | 97.9 /100 | #102 | Exceptional 1.8% |
| Basques | 97.9 /100 | #103 | Exceptional 1.8% |
| Thais | 97.5 /100 | #104 | Exceptional 1.8% |
| German Russians | 97.5 /100 | #105 | Exceptional 1.8% |
| Immigrants | France | 97.3 /100 | #106 | Exceptional 1.8% |
| Yugoslavians | 97.2 /100 | #107 | Exceptional 1.8% |
| Okinawans | 97.1 /100 | #108 | Exceptional 1.8% |
| Immigrants | Saudi Arabia | 96.8 /100 | #109 | Exceptional 1.9% |
| Immigrants | Latvia | 96.7 /100 | #110 | Exceptional 1.9% |
| Immigrants | Japan | 96.6 /100 | #111 | Exceptional 1.9% |
| Pueblo | 96.4 /100 | #112 | Exceptional 1.9% |
| Immigrants | Zimbabwe | 96.2 /100 | #113 | Exceptional 1.9% |
| Immigrants | Norway | 96.1 /100 | #114 | Exceptional 1.9% |
| Syrians | 96.0 /100 | #115 | Exceptional 1.9% |