Arab vs Korean Associate's Degree
COMPARE
Arab
Korean
Associate's Degree
Associate's Degree Comparison
Arabs
Koreans
49.0%
ASSOCIATE'S DEGREE
95.3/ 100
METRIC RATING
114th/ 347
METRIC RANK
45.8%
ASSOCIATE'S DEGREE
33.8/ 100
METRIC RATING
191st/ 347
METRIC RANK
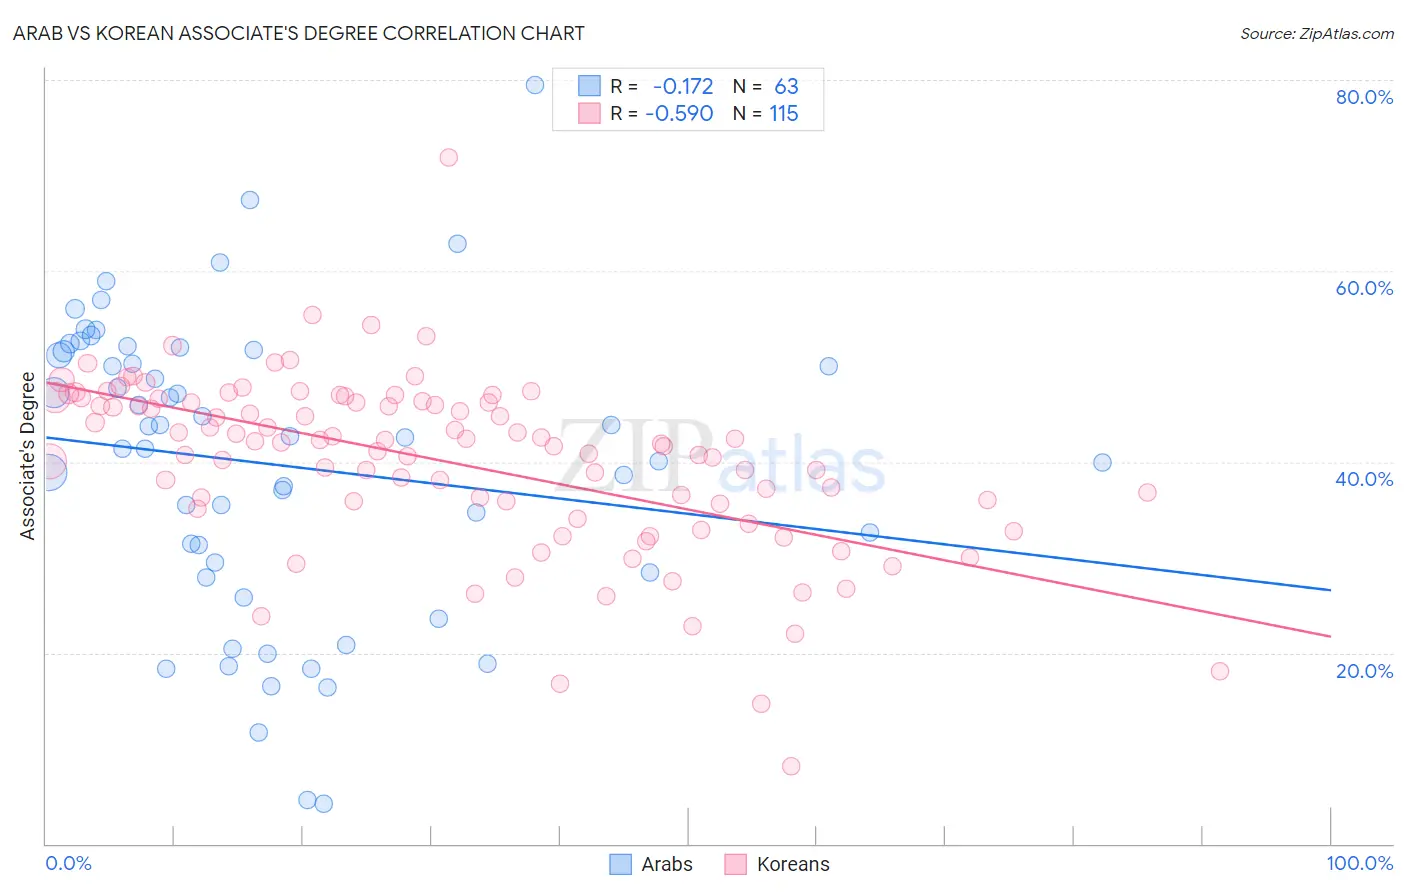
Arab vs Korean Associate's Degree Correlation Chart
The statistical analysis conducted on geographies consisting of 486,836,450 people shows a poor negative correlation between the proportion of Arabs and percentage of population with at least associate's degree education in the United States with a correlation coefficient (R) of -0.172 and weighted average of 49.0%. Similarly, the statistical analysis conducted on geographies consisting of 510,898,568 people shows a substantial negative correlation between the proportion of Koreans and percentage of population with at least associate's degree education in the United States with a correlation coefficient (R) of -0.590 and weighted average of 45.8%, a difference of 7.0%.
Associate's Degree Correlation Summary
| Measurement | Arab | Korean |
| Minimum | 4.3% | 8.1% |
| Maximum | 79.5% | 71.9% |
| Range | 75.3% | 63.8% |
| Mean | 39.7% | 40.0% |
| Median | 42.6% | 42.1% |
| Interquartile 25% (IQ1) | 28.4% | 35.6% |
| Interquartile 75% (IQ3) | 51.6% | 46.3% |
| Interquartile Range (IQR) | 23.3% | 10.7% |
| Standard Deviation (Sample) | 15.6% | 9.2% |
| Standard Deviation (Population) | 15.5% | 9.2% |
Similar Demographics by Associate's Degree
Demographics Similar to Arabs by Associate's Degree
In terms of associate's degree, the demographic groups most similar to Arabs are Immigrants from Chile (49.0%, a difference of 0.0%), Palestinian (49.0%, a difference of 0.0%), Luxembourger (48.9%, a difference of 0.070%), British (48.9%, a difference of 0.13%), and Afghan (48.9%, a difference of 0.18%).
| Demographics | Rating | Rank | Associate's Degree |
| Syrians | 96.7 /100 | #107 | Exceptional 49.3% |
| Jordanians | 96.6 /100 | #108 | Exceptional 49.2% |
| Immigrants | Morocco | 96.3 /100 | #109 | Exceptional 49.2% |
| Austrians | 95.8 /100 | #110 | Exceptional 49.1% |
| Immigrants | Venezuela | 95.8 /100 | #111 | Exceptional 49.1% |
| Immigrants | Chile | 95.3 /100 | #112 | Exceptional 49.0% |
| Palestinians | 95.3 /100 | #113 | Exceptional 49.0% |
| Arabs | 95.3 /100 | #114 | Exceptional 49.0% |
| Luxembourgers | 95.1 /100 | #115 | Exceptional 48.9% |
| British | 95.0 /100 | #116 | Exceptional 48.9% |
| Afghans | 94.8 /100 | #117 | Exceptional 48.9% |
| Albanians | 94.7 /100 | #118 | Exceptional 48.8% |
| Lebanese | 94.6 /100 | #119 | Exceptional 48.8% |
| Alsatians | 94.6 /100 | #120 | Exceptional 48.8% |
| Ugandans | 93.9 /100 | #121 | Exceptional 48.7% |
Demographics Similar to Koreans by Associate's Degree
In terms of associate's degree, the demographic groups most similar to Koreans are Vietnamese (45.8%, a difference of 0.020%), Celtic (45.8%, a difference of 0.050%), Immigrants from Oceania (45.8%, a difference of 0.070%), Ghanaian (45.8%, a difference of 0.13%), and Immigrants from Uruguay (45.8%, a difference of 0.14%).
| Demographics | Rating | Rank | Associate's Degree |
| Czechoslovakians | 40.0 /100 | #184 | Average 46.0% |
| Costa Ricans | 38.6 /100 | #185 | Fair 46.0% |
| Welsh | 37.9 /100 | #186 | Fair 45.9% |
| Immigrants | Uruguay | 35.5 /100 | #187 | Fair 45.8% |
| Ghanaians | 35.5 /100 | #188 | Fair 45.8% |
| Immigrants | Oceania | 34.7 /100 | #189 | Fair 45.8% |
| Vietnamese | 34.0 /100 | #190 | Fair 45.8% |
| Koreans | 33.8 /100 | #191 | Fair 45.8% |
| Celtics | 33.3 /100 | #192 | Fair 45.8% |
| Immigrants | Cameroon | 31.0 /100 | #193 | Fair 45.7% |
| Immigrants | Peru | 27.6 /100 | #194 | Fair 45.5% |
| Germans | 26.5 /100 | #195 | Fair 45.5% |
| French | 25.6 /100 | #196 | Fair 45.4% |
| Scotch-Irish | 22.3 /100 | #197 | Fair 45.3% |
| Immigrants | Bangladesh | 21.3 /100 | #198 | Fair 45.2% |