Immigrants from Argentina vs Korean Associate's Degree
COMPARE
Immigrants from Argentina
Korean
Associate's Degree
Associate's Degree Comparison
Immigrants from Argentina
Koreans
50.9%
ASSOCIATE'S DEGREE
99.5/ 100
METRIC RATING
70th/ 347
METRIC RANK
45.8%
ASSOCIATE'S DEGREE
33.8/ 100
METRIC RATING
191st/ 347
METRIC RANK
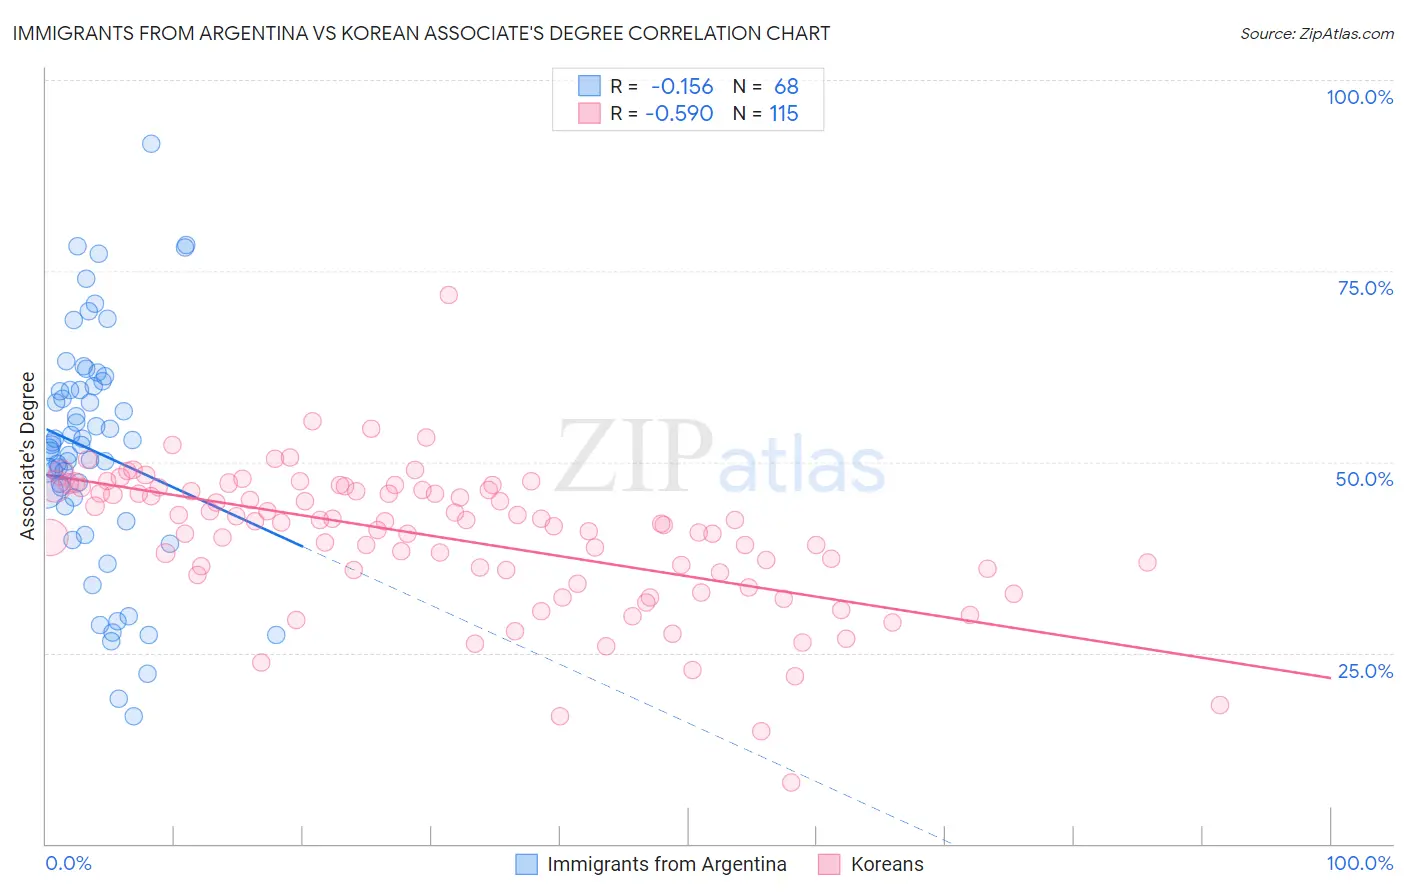
Immigrants from Argentina vs Korean Associate's Degree Correlation Chart
The statistical analysis conducted on geographies consisting of 264,422,304 people shows a poor negative correlation between the proportion of Immigrants from Argentina and percentage of population with at least associate's degree education in the United States with a correlation coefficient (R) of -0.156 and weighted average of 50.9%. Similarly, the statistical analysis conducted on geographies consisting of 510,898,568 people shows a substantial negative correlation between the proportion of Koreans and percentage of population with at least associate's degree education in the United States with a correlation coefficient (R) of -0.590 and weighted average of 45.8%, a difference of 11.2%.
Associate's Degree Correlation Summary
| Measurement | Immigrants from Argentina | Korean |
| Minimum | 16.7% | 8.1% |
| Maximum | 91.7% | 71.9% |
| Range | 75.0% | 63.8% |
| Mean | 51.4% | 40.0% |
| Median | 52.3% | 42.1% |
| Interquartile 25% (IQ1) | 44.7% | 35.6% |
| Interquartile 75% (IQ3) | 59.7% | 46.3% |
| Interquartile Range (IQR) | 15.0% | 10.7% |
| Standard Deviation (Sample) | 15.2% | 9.2% |
| Standard Deviation (Population) | 15.1% | 9.2% |
Similar Demographics by Associate's Degree
Demographics Similar to Immigrants from Argentina by Associate's Degree
In terms of associate's degree, the demographic groups most similar to Immigrants from Argentina are Immigrants from Romania (50.9%, a difference of 0.010%), Egyptian (50.9%, a difference of 0.030%), Immigrants from Pakistan (50.9%, a difference of 0.070%), Immigrants from Indonesia (51.0%, a difference of 0.15%), and Carpatho Rusyn (50.6%, a difference of 0.54%).
| Demographics | Rating | Rank | Associate's Degree |
| South Africans | 99.7 /100 | #63 | Exceptional 51.4% |
| Immigrants | Netherlands | 99.7 /100 | #64 | Exceptional 51.4% |
| Zimbabweans | 99.7 /100 | #65 | Exceptional 51.3% |
| Immigrants | Europe | 99.7 /100 | #66 | Exceptional 51.3% |
| Argentineans | 99.6 /100 | #67 | Exceptional 51.2% |
| Immigrants | Indonesia | 99.5 /100 | #68 | Exceptional 51.0% |
| Egyptians | 99.5 /100 | #69 | Exceptional 50.9% |
| Immigrants | Argentina | 99.5 /100 | #70 | Exceptional 50.9% |
| Immigrants | Romania | 99.5 /100 | #71 | Exceptional 50.9% |
| Immigrants | Pakistan | 99.5 /100 | #72 | Exceptional 50.9% |
| Carpatho Rusyns | 99.3 /100 | #73 | Exceptional 50.6% |
| Lithuanians | 99.3 /100 | #74 | Exceptional 50.6% |
| Immigrants | Scotland | 99.3 /100 | #75 | Exceptional 50.6% |
| Immigrants | Zimbabwe | 99.2 /100 | #76 | Exceptional 50.5% |
| Immigrants | Lebanon | 99.1 /100 | #77 | Exceptional 50.5% |
Demographics Similar to Koreans by Associate's Degree
In terms of associate's degree, the demographic groups most similar to Koreans are Vietnamese (45.8%, a difference of 0.020%), Celtic (45.8%, a difference of 0.050%), Immigrants from Oceania (45.8%, a difference of 0.070%), Ghanaian (45.8%, a difference of 0.13%), and Immigrants from Uruguay (45.8%, a difference of 0.14%).
| Demographics | Rating | Rank | Associate's Degree |
| Czechoslovakians | 40.0 /100 | #184 | Average 46.0% |
| Costa Ricans | 38.6 /100 | #185 | Fair 46.0% |
| Welsh | 37.9 /100 | #186 | Fair 45.9% |
| Immigrants | Uruguay | 35.5 /100 | #187 | Fair 45.8% |
| Ghanaians | 35.5 /100 | #188 | Fair 45.8% |
| Immigrants | Oceania | 34.7 /100 | #189 | Fair 45.8% |
| Vietnamese | 34.0 /100 | #190 | Fair 45.8% |
| Koreans | 33.8 /100 | #191 | Fair 45.8% |
| Celtics | 33.3 /100 | #192 | Fair 45.8% |
| Immigrants | Cameroon | 31.0 /100 | #193 | Fair 45.7% |
| Immigrants | Peru | 27.6 /100 | #194 | Fair 45.5% |
| Germans | 26.5 /100 | #195 | Fair 45.5% |
| French | 25.6 /100 | #196 | Fair 45.4% |
| Scotch-Irish | 22.3 /100 | #197 | Fair 45.3% |
| Immigrants | Bangladesh | 21.3 /100 | #198 | Fair 45.2% |