Immigrants from Philippines vs Korean Associate's Degree
COMPARE
Immigrants from Philippines
Korean
Associate's Degree
Associate's Degree Comparison
Immigrants from Philippines
Koreans
45.0%
ASSOCIATE'S DEGREE
16.7/ 100
METRIC RATING
210th/ 347
METRIC RANK
45.8%
ASSOCIATE'S DEGREE
33.8/ 100
METRIC RATING
191st/ 347
METRIC RANK
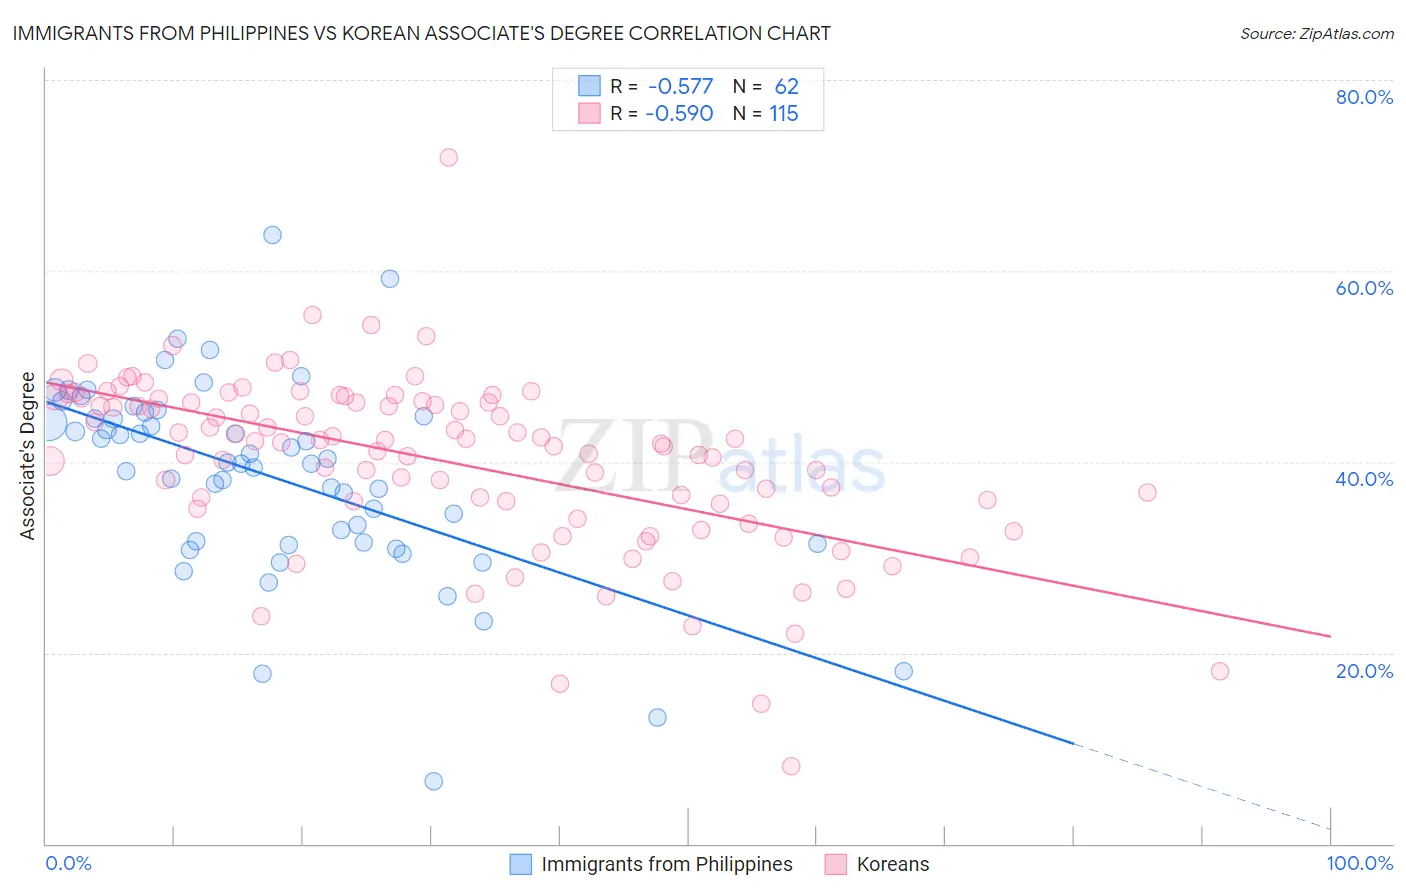
Immigrants from Philippines vs Korean Associate's Degree Correlation Chart
The statistical analysis conducted on geographies consisting of 471,293,410 people shows a substantial negative correlation between the proportion of Immigrants from Philippines and percentage of population with at least associate's degree education in the United States with a correlation coefficient (R) of -0.577 and weighted average of 45.0%. Similarly, the statistical analysis conducted on geographies consisting of 510,898,568 people shows a substantial negative correlation between the proportion of Koreans and percentage of population with at least associate's degree education in the United States with a correlation coefficient (R) of -0.590 and weighted average of 45.8%, a difference of 1.8%.
Associate's Degree Correlation Summary
| Measurement | Immigrants from Philippines | Korean |
| Minimum | 6.5% | 8.1% |
| Maximum | 63.7% | 71.9% |
| Range | 57.2% | 63.8% |
| Mean | 38.5% | 40.0% |
| Median | 39.9% | 42.1% |
| Interquartile 25% (IQ1) | 31.5% | 35.6% |
| Interquartile 75% (IQ3) | 44.8% | 46.3% |
| Interquartile Range (IQR) | 13.3% | 10.7% |
| Standard Deviation (Sample) | 10.2% | 9.2% |
| Standard Deviation (Population) | 10.2% | 9.2% |
Demographics Similar to Immigrants from Philippines and Koreans by Associate's Degree
In terms of associate's degree, the demographic groups most similar to Immigrants from Philippines are Immigrants from Costa Rica (45.0%, a difference of 0.010%), Dutch (45.0%, a difference of 0.12%), Panamanian (45.1%, a difference of 0.22%), Immigrants from Thailand (45.1%, a difference of 0.29%), and German Russian (45.1%, a difference of 0.29%). Similarly, the demographic groups most similar to Koreans are Vietnamese (45.8%, a difference of 0.020%), Celtic (45.8%, a difference of 0.050%), Immigrants from Cameroon (45.7%, a difference of 0.24%), Immigrants from Peru (45.5%, a difference of 0.56%), and German (45.5%, a difference of 0.67%).
| Demographics | Rating | Rank | Associate's Degree |
| Vietnamese | 34.0 /100 | #190 | Fair 45.8% |
| Koreans | 33.8 /100 | #191 | Fair 45.8% |
| Celtics | 33.3 /100 | #192 | Fair 45.8% |
| Immigrants | Cameroon | 31.0 /100 | #193 | Fair 45.7% |
| Immigrants | Peru | 27.6 /100 | #194 | Fair 45.5% |
| Germans | 26.5 /100 | #195 | Fair 45.5% |
| French | 25.6 /100 | #196 | Fair 45.4% |
| Scotch-Irish | 22.3 /100 | #197 | Fair 45.3% |
| Immigrants | Bangladesh | 21.3 /100 | #198 | Fair 45.2% |
| Immigrants | Senegal | 21.2 /100 | #199 | Fair 45.2% |
| Senegalese | 21.1 /100 | #200 | Fair 45.2% |
| Immigrants | Vietnam | 20.8 /100 | #201 | Fair 45.2% |
| Spaniards | 20.4 /100 | #202 | Fair 45.2% |
| Immigrants | South Eastern Asia | 20.2 /100 | #203 | Fair 45.2% |
| Nigerians | 19.1 /100 | #204 | Poor 45.1% |
| Immigrants | Thailand | 18.9 /100 | #205 | Poor 45.1% |
| German Russians | 18.9 /100 | #206 | Poor 45.1% |
| Panamanians | 18.4 /100 | #207 | Poor 45.1% |
| Dutch | 17.6 /100 | #208 | Poor 45.0% |
| Immigrants | Costa Rica | 16.7 /100 | #209 | Poor 45.0% |
| Immigrants | Philippines | 16.7 /100 | #210 | Poor 45.0% |