Turkish vs Immigrants from Portugal No Schooling Completed
COMPARE
Turkish
Immigrants from Portugal
No Schooling Completed
No Schooling Completed Comparison
Turks
Immigrants from Portugal
1.8%
NO SCHOOLING COMPLETED
98.7/ 100
METRIC RATING
93rd/ 347
METRIC RANK
2.7%
NO SCHOOLING COMPLETED
0.0/ 100
METRIC RATING
286th/ 347
METRIC RANK
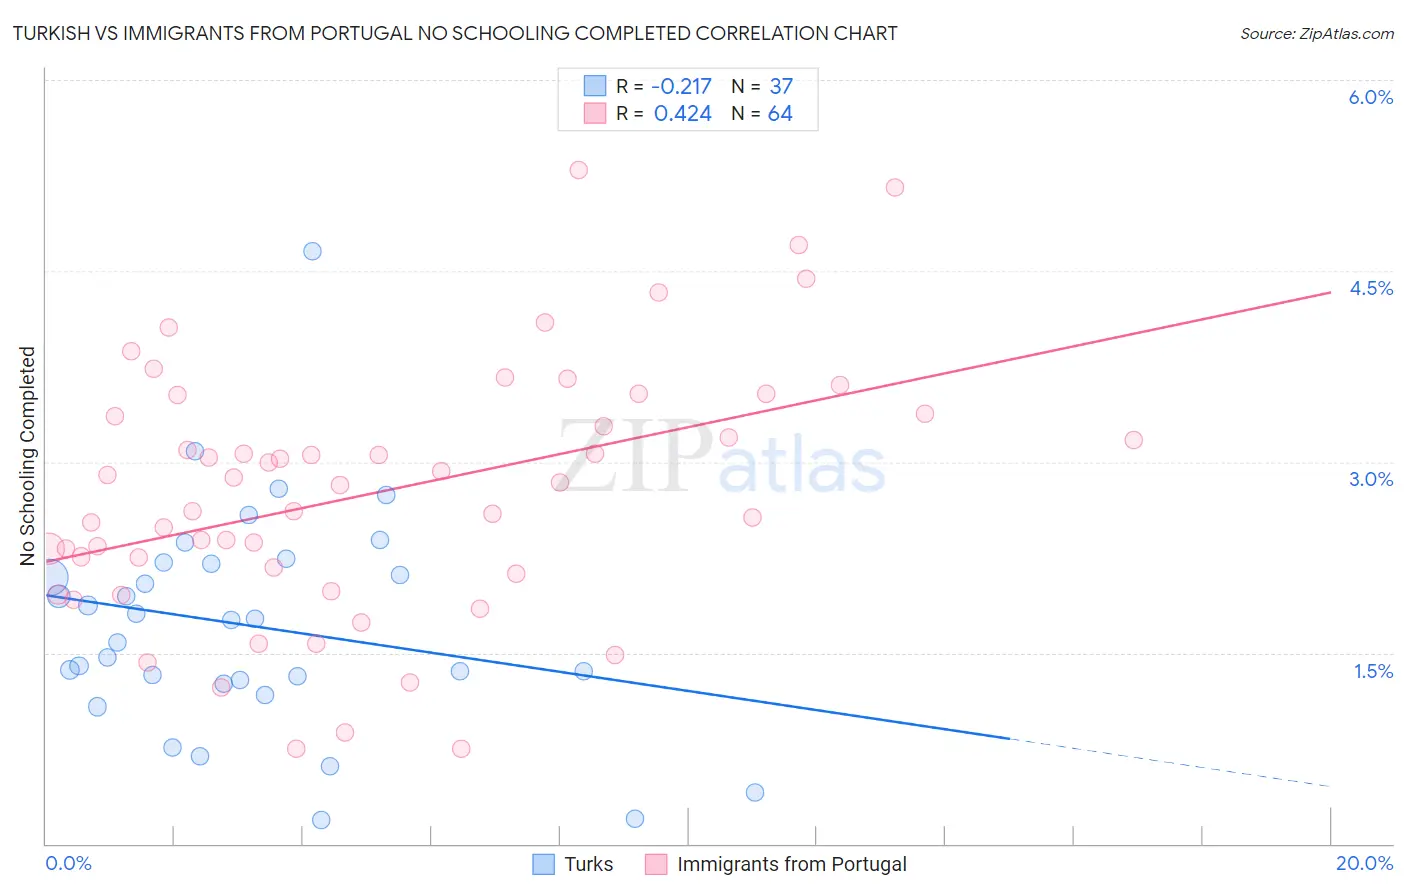
Turkish vs Immigrants from Portugal No Schooling Completed Correlation Chart
The statistical analysis conducted on geographies consisting of 270,038,657 people shows a weak negative correlation between the proportion of Turks and percentage of population with no schooling in the United States with a correlation coefficient (R) of -0.217 and weighted average of 1.8%. Similarly, the statistical analysis conducted on geographies consisting of 174,032,123 people shows a moderate positive correlation between the proportion of Immigrants from Portugal and percentage of population with no schooling in the United States with a correlation coefficient (R) of 0.424 and weighted average of 2.7%, a difference of 49.3%.
No Schooling Completed Correlation Summary
| Measurement | Turkish | Immigrants from Portugal |
| Minimum | 0.19% | 0.74% |
| Maximum | 4.7% | 5.3% |
| Range | 4.5% | 4.6% |
| Mean | 1.7% | 2.8% |
| Median | 1.8% | 2.8% |
| Interquartile 25% (IQ1) | 1.3% | 2.1% |
| Interquartile 75% (IQ3) | 2.2% | 3.4% |
| Interquartile Range (IQR) | 0.94% | 1.2% |
| Standard Deviation (Sample) | 0.87% | 1.00% |
| Standard Deviation (Population) | 0.86% | 0.99% |
Similar Demographics by No Schooling Completed
Demographics Similar to Turks by No Schooling Completed
In terms of no schooling completed, the demographic groups most similar to Turks are Romanian (1.8%, a difference of 0.37%), Nonimmigrants (1.8%, a difference of 0.50%), Puget Sound Salish (1.8%, a difference of 0.51%), Bhutanese (1.8%, a difference of 0.74%), and Immigrants from Germany (1.8%, a difference of 0.89%).
| Demographics | Rating | Rank | No Schooling Completed |
| Ukrainians | 99.2 /100 | #86 | Exceptional 1.8% |
| Osage | 99.2 /100 | #87 | Exceptional 1.8% |
| Immigrants | Western Europe | 99.2 /100 | #88 | Exceptional 1.8% |
| South Africans | 99.1 /100 | #89 | Exceptional 1.8% |
| Sioux | 99.0 /100 | #90 | Exceptional 1.8% |
| Immigrants | Germany | 99.0 /100 | #91 | Exceptional 1.8% |
| Romanians | 98.8 /100 | #92 | Exceptional 1.8% |
| Turks | 98.7 /100 | #93 | Exceptional 1.8% |
| Immigrants | Nonimmigrants | 98.5 /100 | #94 | Exceptional 1.8% |
| Puget Sound Salish | 98.5 /100 | #95 | Exceptional 1.8% |
| Bhutanese | 98.4 /100 | #96 | Exceptional 1.8% |
| Immigrants | Ireland | 98.4 /100 | #97 | Exceptional 1.8% |
| Iranians | 98.2 /100 | #98 | Exceptional 1.8% |
| Choctaw | 98.1 /100 | #99 | Exceptional 1.8% |
| Immigrants | Singapore | 98.0 /100 | #100 | Exceptional 1.8% |
Demographics Similar to Immigrants from Portugal by No Schooling Completed
In terms of no schooling completed, the demographic groups most similar to Immigrants from Portugal are Immigrants from Barbados (2.7%, a difference of 0.42%), Immigrants from West Indies (2.7%, a difference of 0.49%), Immigrants from Afghanistan (2.7%, a difference of 0.81%), Immigrants from St. Vincent and the Grenadines (2.7%, a difference of 0.91%), and Immigrants from Trinidad and Tobago (2.6%, a difference of 1.2%).
| Demographics | Rating | Rank | No Schooling Completed |
| Barbadians | 0.1 /100 | #279 | Tragic 2.6% |
| Trinidadians and Tobagonians | 0.1 /100 | #280 | Tragic 2.6% |
| Afghans | 0.1 /100 | #281 | Tragic 2.6% |
| Immigrants | Ghana | 0.1 /100 | #282 | Tragic 2.6% |
| Immigrants | Trinidad and Tobago | 0.0 /100 | #283 | Tragic 2.6% |
| Immigrants | West Indies | 0.0 /100 | #284 | Tragic 2.7% |
| Immigrants | Barbados | 0.0 /100 | #285 | Tragic 2.7% |
| Immigrants | Portugal | 0.0 /100 | #286 | Tragic 2.7% |
| Immigrants | Afghanistan | 0.0 /100 | #287 | Tragic 2.7% |
| Immigrants | St. Vincent and the Grenadines | 0.0 /100 | #288 | Tragic 2.7% |
| Immigrants | Thailand | 0.0 /100 | #289 | Tragic 2.7% |
| Immigrants | Hong Kong | 0.0 /100 | #290 | Tragic 2.7% |
| British West Indians | 0.0 /100 | #291 | Tragic 2.7% |
| Immigrants | Grenada | 0.0 /100 | #292 | Tragic 2.8% |
| Malaysians | 0.0 /100 | #293 | Tragic 2.8% |