Dominican vs Immigrants from Portugal Unemployment Among Seniors over 65 years
COMPARE
Dominican
Immigrants from Portugal
Unemployment Among Seniors over 65 years
Unemployment Among Seniors over 65 years Comparison
Dominicans
Immigrants from Portugal
6.0%
UNEMPLOYMENT AMONG SENIORS OVER 65 YEARS
0.0/ 100
METRIC RATING
329th/ 347
METRIC RANK
6.0%
UNEMPLOYMENT AMONG SENIORS OVER 65 YEARS
0.0/ 100
METRIC RATING
330th/ 347
METRIC RANK
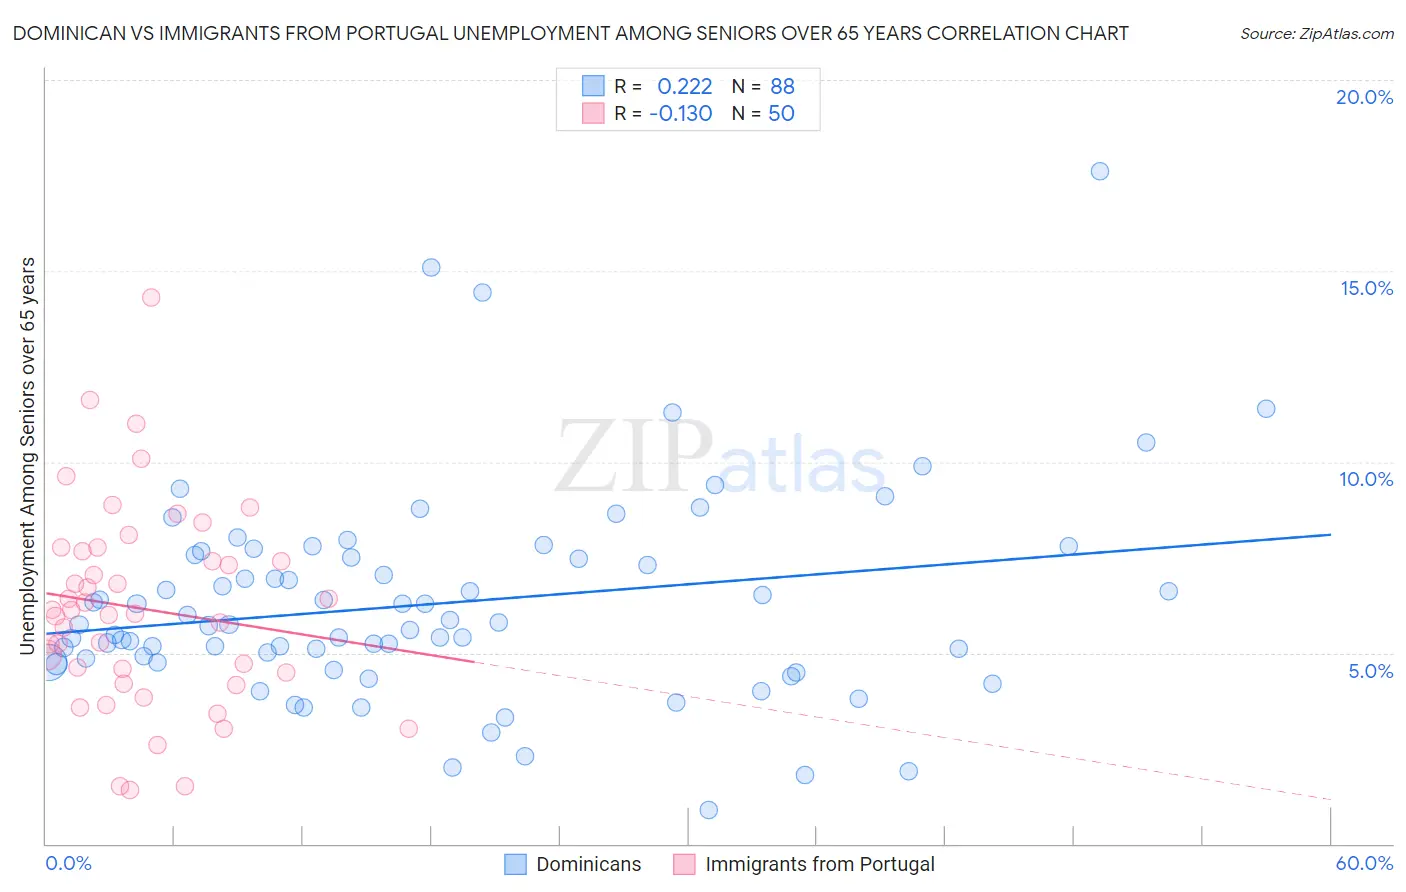
Dominican vs Immigrants from Portugal Unemployment Among Seniors over 65 years Correlation Chart
The statistical analysis conducted on geographies consisting of 321,846,099 people shows a weak positive correlation between the proportion of Dominicans and unemployment rate amomg seniors over the age of 65 in the United States with a correlation coefficient (R) of 0.222 and weighted average of 6.0%. Similarly, the statistical analysis conducted on geographies consisting of 166,846,438 people shows a poor negative correlation between the proportion of Immigrants from Portugal and unemployment rate amomg seniors over the age of 65 in the United States with a correlation coefficient (R) of -0.130 and weighted average of 6.0%, a difference of 0.020%.
Unemployment Among Seniors over 65 years Correlation Summary
| Measurement | Dominican | Immigrants from Portugal |
| Minimum | 0.90% | 1.4% |
| Maximum | 17.6% | 14.3% |
| Range | 16.7% | 12.9% |
| Mean | 6.3% | 6.2% |
| Median | 5.7% | 6.1% |
| Interquartile 25% (IQ1) | 4.8% | 4.5% |
| Interquartile 75% (IQ3) | 7.5% | 7.7% |
| Interquartile Range (IQR) | 2.7% | 3.2% |
| Standard Deviation (Sample) | 2.7% | 2.6% |
| Standard Deviation (Population) | 2.7% | 2.6% |
Demographics Similar to Dominicans and Immigrants from Portugal by Unemployment Among Seniors over 65 years
In terms of unemployment among seniors over 65 years, the demographic groups most similar to Dominicans are Taiwanese (6.0%, a difference of 0.17%), Aleut (6.0%, a difference of 0.22%), Puerto Rican (5.9%, a difference of 0.75%), Immigrants from Dominican Republic (6.0%, a difference of 0.77%), and Bermudan (5.9%, a difference of 1.3%). Similarly, the demographic groups most similar to Immigrants from Portugal are Taiwanese (6.0%, a difference of 0.15%), Aleut (6.0%, a difference of 0.20%), Immigrants from Dominican Republic (6.0%, a difference of 0.75%), Puerto Rican (5.9%, a difference of 0.77%), and Bermudan (5.9%, a difference of 1.3%).
| Demographics | Rating | Rank | Unemployment Among Seniors over 65 years |
| Immigrants | Bangladesh | 0.0 /100 | #319 | Tragic 5.7% |
| Immigrants | Mexico | 0.0 /100 | #320 | Tragic 5.7% |
| British West Indians | 0.0 /100 | #321 | Tragic 5.8% |
| Natives/Alaskans | 0.0 /100 | #322 | Tragic 5.8% |
| Immigrants | Dominica | 0.0 /100 | #323 | Tragic 5.8% |
| Yuman | 0.0 /100 | #324 | Tragic 5.8% |
| Inupiat | 0.0 /100 | #325 | Tragic 5.8% |
| Shoshone | 0.0 /100 | #326 | Tragic 5.9% |
| Bermudans | 0.0 /100 | #327 | Tragic 5.9% |
| Puerto Ricans | 0.0 /100 | #328 | Tragic 5.9% |
| Dominicans | 0.0 /100 | #329 | Tragic 6.0% |
| Immigrants | Portugal | 0.0 /100 | #330 | Tragic 6.0% |
| Taiwanese | 0.0 /100 | #331 | Tragic 6.0% |
| Aleuts | 0.0 /100 | #332 | Tragic 6.0% |
| Immigrants | Dominican Republic | 0.0 /100 | #333 | Tragic 6.0% |
| Tohono O'odham | 0.0 /100 | #334 | Tragic 6.1% |
| Immigrants | Armenia | 0.0 /100 | #335 | Tragic 6.2% |
| Pima | 0.0 /100 | #336 | Tragic 6.3% |
| Alaska Natives | 0.0 /100 | #337 | Tragic 6.3% |
| Immigrants | Azores | 0.0 /100 | #338 | Tragic 6.3% |
| Paiute | 0.0 /100 | #339 | Tragic 6.3% |