Black/African American vs Immigrants from Portugal No Schooling Completed
COMPARE
Black/African American
Immigrants from Portugal
No Schooling Completed
No Schooling Completed Comparison
Blacks/African Americans
Immigrants from Portugal
2.1%
NO SCHOOLING COMPLETED
41.4/ 100
METRIC RATING
183rd/ 347
METRIC RANK
2.7%
NO SCHOOLING COMPLETED
0.0/ 100
METRIC RATING
286th/ 347
METRIC RANK
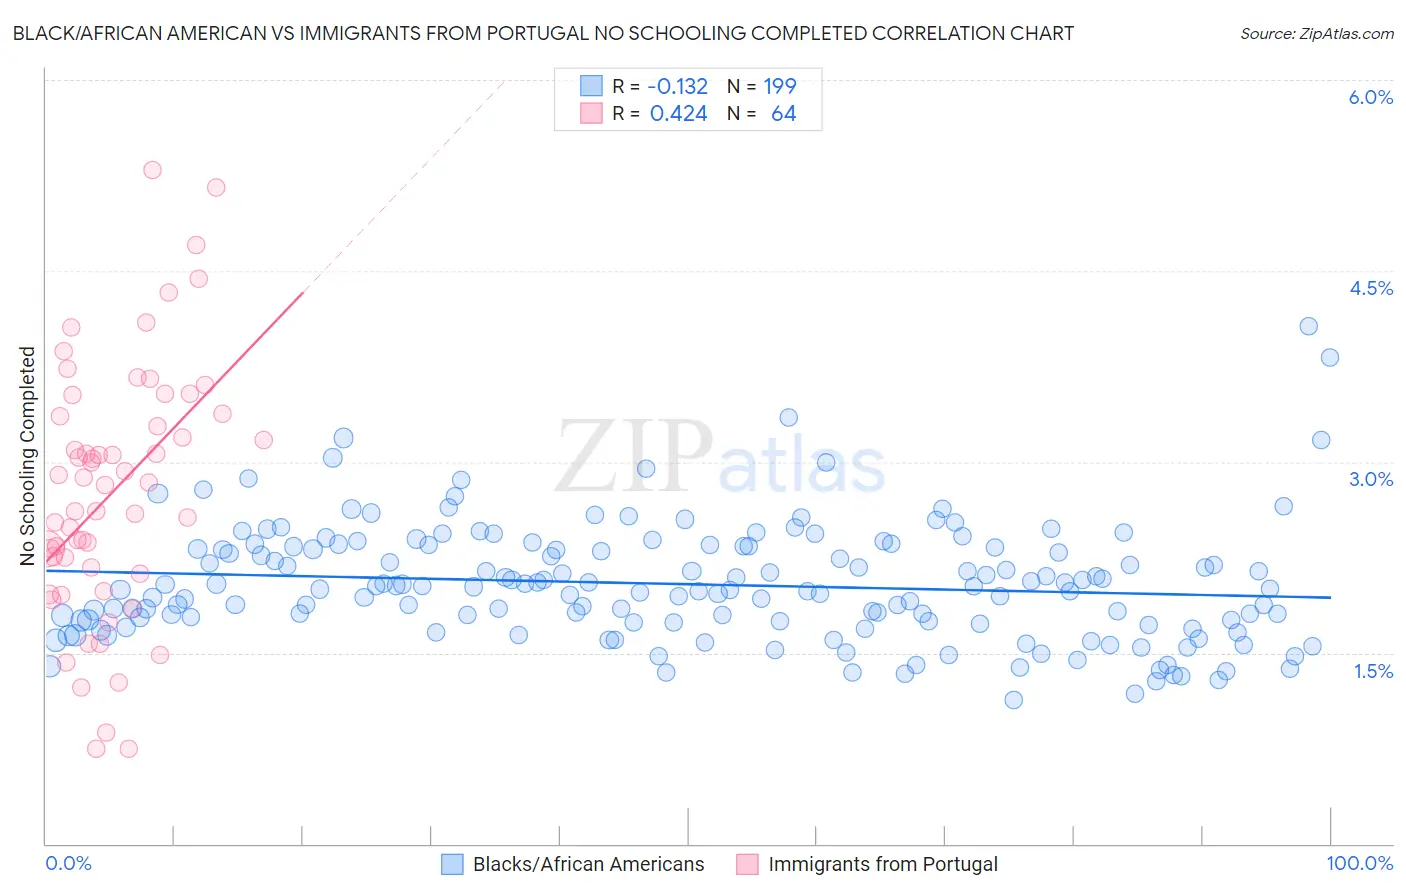
Black/African American vs Immigrants from Portugal No Schooling Completed Correlation Chart
The statistical analysis conducted on geographies consisting of 551,024,391 people shows a poor negative correlation between the proportion of Blacks/African Americans and percentage of population with no schooling in the United States with a correlation coefficient (R) of -0.132 and weighted average of 2.1%. Similarly, the statistical analysis conducted on geographies consisting of 174,032,123 people shows a moderate positive correlation between the proportion of Immigrants from Portugal and percentage of population with no schooling in the United States with a correlation coefficient (R) of 0.424 and weighted average of 2.7%, a difference of 26.1%.
No Schooling Completed Correlation Summary
| Measurement | Black/African American | Immigrants from Portugal |
| Minimum | 1.1% | 0.74% |
| Maximum | 4.1% | 5.3% |
| Range | 2.9% | 4.6% |
| Mean | 2.0% | 2.8% |
| Median | 2.0% | 2.8% |
| Interquartile 25% (IQ1) | 1.7% | 2.1% |
| Interquartile 75% (IQ3) | 2.3% | 3.4% |
| Interquartile Range (IQR) | 0.59% | 1.2% |
| Standard Deviation (Sample) | 0.46% | 1.00% |
| Standard Deviation (Population) | 0.46% | 0.99% |
Similar Demographics by No Schooling Completed
Demographics Similar to Blacks/African Americans by No Schooling Completed
In terms of no schooling completed, the demographic groups most similar to Blacks/African Americans are Pima (2.1%, a difference of 0.020%), Mongolian (2.1%, a difference of 0.090%), French American Indian (2.1%, a difference of 0.10%), Immigrants from Taiwan (2.1%, a difference of 0.15%), and Portuguese (2.1%, a difference of 0.33%).
| Demographics | Rating | Rank | No Schooling Completed |
| Panamanians | 45.2 /100 | #176 | Average 2.1% |
| Arapaho | 45.0 /100 | #177 | Average 2.1% |
| Pakistanis | 44.7 /100 | #178 | Average 2.1% |
| Immigrants | Kazakhstan | 44.3 /100 | #179 | Average 2.1% |
| Portuguese | 43.9 /100 | #180 | Average 2.1% |
| Immigrants | Taiwan | 42.6 /100 | #181 | Average 2.1% |
| French American Indians | 42.2 /100 | #182 | Average 2.1% |
| Blacks/African Americans | 41.4 /100 | #183 | Average 2.1% |
| Pima | 41.3 /100 | #184 | Average 2.1% |
| Mongolians | 40.8 /100 | #185 | Average 2.1% |
| Immigrants | Bosnia and Herzegovina | 38.6 /100 | #186 | Fair 2.1% |
| Navajo | 36.5 /100 | #187 | Fair 2.1% |
| Immigrants | Kenya | 36.2 /100 | #188 | Fair 2.1% |
| Immigrants | Egypt | 36.1 /100 | #189 | Fair 2.1% |
| Spanish Americans | 32.6 /100 | #190 | Fair 2.1% |
Demographics Similar to Immigrants from Portugal by No Schooling Completed
In terms of no schooling completed, the demographic groups most similar to Immigrants from Portugal are Immigrants from Barbados (2.7%, a difference of 0.42%), Immigrants from West Indies (2.7%, a difference of 0.49%), Immigrants from Afghanistan (2.7%, a difference of 0.81%), Immigrants from St. Vincent and the Grenadines (2.7%, a difference of 0.91%), and Immigrants from Trinidad and Tobago (2.6%, a difference of 1.2%).
| Demographics | Rating | Rank | No Schooling Completed |
| Barbadians | 0.1 /100 | #279 | Tragic 2.6% |
| Trinidadians and Tobagonians | 0.1 /100 | #280 | Tragic 2.6% |
| Afghans | 0.1 /100 | #281 | Tragic 2.6% |
| Immigrants | Ghana | 0.1 /100 | #282 | Tragic 2.6% |
| Immigrants | Trinidad and Tobago | 0.0 /100 | #283 | Tragic 2.6% |
| Immigrants | West Indies | 0.0 /100 | #284 | Tragic 2.7% |
| Immigrants | Barbados | 0.0 /100 | #285 | Tragic 2.7% |
| Immigrants | Portugal | 0.0 /100 | #286 | Tragic 2.7% |
| Immigrants | Afghanistan | 0.0 /100 | #287 | Tragic 2.7% |
| Immigrants | St. Vincent and the Grenadines | 0.0 /100 | #288 | Tragic 2.7% |
| Immigrants | Thailand | 0.0 /100 | #289 | Tragic 2.7% |
| Immigrants | Hong Kong | 0.0 /100 | #290 | Tragic 2.7% |
| British West Indians | 0.0 /100 | #291 | Tragic 2.7% |
| Immigrants | Grenada | 0.0 /100 | #292 | Tragic 2.8% |
| Malaysians | 0.0 /100 | #293 | Tragic 2.8% |