Czech vs Nigerian No Schooling Completed
COMPARE
Czech
Nigerian
No Schooling Completed
No Schooling Completed Comparison
Czechs
Nigerians
1.5%
NO SCHOOLING COMPLETED
100.0/ 100
METRIC RATING
26th/ 347
METRIC RANK
2.3%
NO SCHOOLING COMPLETED
2.6/ 100
METRIC RATING
234th/ 347
METRIC RANK
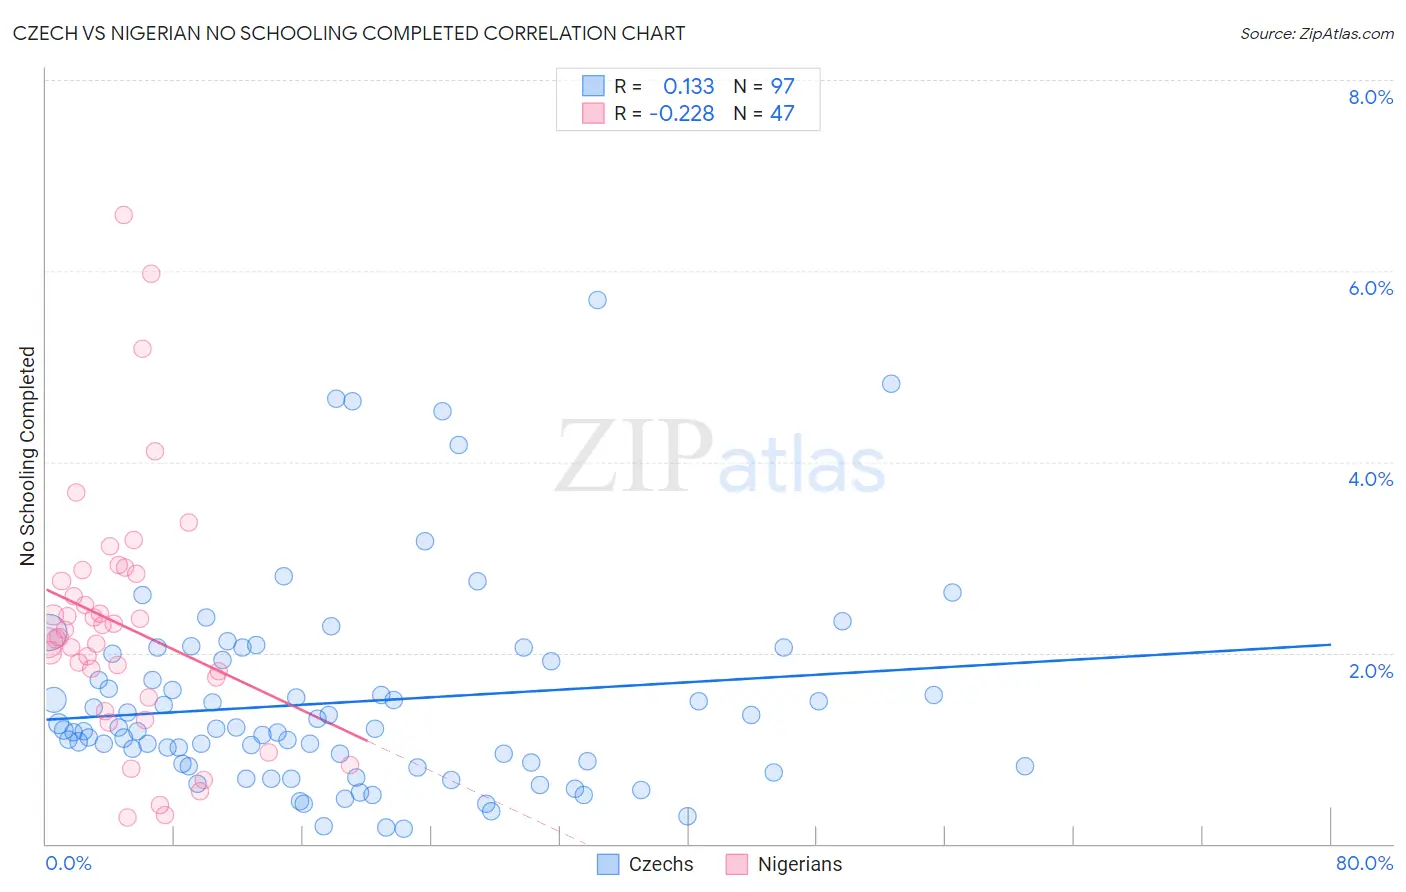
Czech vs Nigerian No Schooling Completed Correlation Chart
The statistical analysis conducted on geographies consisting of 474,064,370 people shows a poor positive correlation between the proportion of Czechs and percentage of population with no schooling in the United States with a correlation coefficient (R) of 0.133 and weighted average of 1.5%. Similarly, the statistical analysis conducted on geographies consisting of 330,931,802 people shows a weak negative correlation between the proportion of Nigerians and percentage of population with no schooling in the United States with a correlation coefficient (R) of -0.228 and weighted average of 2.3%, a difference of 57.2%.
No Schooling Completed Correlation Summary
| Measurement | Czech | Nigerian |
| Minimum | 0.15% | 0.27% |
| Maximum | 5.7% | 6.6% |
| Range | 5.5% | 6.3% |
| Mean | 1.5% | 2.3% |
| Median | 1.2% | 2.2% |
| Interquartile 25% (IQ1) | 0.82% | 1.5% |
| Interquartile 75% (IQ3) | 1.9% | 2.8% |
| Interquartile Range (IQR) | 1.1% | 1.3% |
| Standard Deviation (Sample) | 1.1% | 1.3% |
| Standard Deviation (Population) | 1.1% | 1.3% |
Similar Demographics by No Schooling Completed
Demographics Similar to Czechs by No Schooling Completed
In terms of no schooling completed, the demographic groups most similar to Czechs are Scandinavian (1.5%, a difference of 0.53%), French Canadian (1.5%, a difference of 0.54%), French (1.5%, a difference of 0.59%), Pennsylvania German (1.5%, a difference of 0.61%), and European (1.5%, a difference of 0.96%).
| Demographics | Rating | Rank | No Schooling Completed |
| Alaskan Athabascans | 100.0 /100 | #19 | Exceptional 1.5% |
| Welsh | 100.0 /100 | #20 | Exceptional 1.5% |
| Chinese | 100.0 /100 | #21 | Exceptional 1.5% |
| Alaska Natives | 100.0 /100 | #22 | Exceptional 1.5% |
| Europeans | 100.0 /100 | #23 | Exceptional 1.5% |
| Pennsylvania Germans | 100.0 /100 | #24 | Exceptional 1.5% |
| French | 100.0 /100 | #25 | Exceptional 1.5% |
| Czechs | 100.0 /100 | #26 | Exceptional 1.5% |
| Scandinavians | 100.0 /100 | #27 | Exceptional 1.5% |
| French Canadians | 100.0 /100 | #28 | Exceptional 1.5% |
| Lumbee | 100.0 /100 | #29 | Exceptional 1.5% |
| British | 100.0 /100 | #30 | Exceptional 1.5% |
| Inupiat | 100.0 /100 | #31 | Exceptional 1.5% |
| Swiss | 100.0 /100 | #32 | Exceptional 1.5% |
| Italians | 100.0 /100 | #33 | Exceptional 1.5% |
Demographics Similar to Nigerians by No Schooling Completed
In terms of no schooling completed, the demographic groups most similar to Nigerians are Immigrants from Western Asia (2.3%, a difference of 0.020%), Immigrants from Malaysia (2.3%, a difference of 0.25%), Iraqi (2.4%, a difference of 0.56%), Colombian (2.3%, a difference of 0.61%), and Immigrants from Eastern Asia (2.4%, a difference of 0.76%).
| Demographics | Rating | Rank | No Schooling Completed |
| Immigrants | Uganda | 4.0 /100 | #227 | Tragic 2.3% |
| U.S. Virgin Islanders | 3.7 /100 | #228 | Tragic 2.3% |
| Immigrants | Pakistan | 3.6 /100 | #229 | Tragic 2.3% |
| Puerto Ricans | 3.4 /100 | #230 | Tragic 2.3% |
| Immigrants | Uruguay | 3.4 /100 | #231 | Tragic 2.3% |
| Colombians | 3.2 /100 | #232 | Tragic 2.3% |
| Immigrants | Malaysia | 2.8 /100 | #233 | Tragic 2.3% |
| Nigerians | 2.6 /100 | #234 | Tragic 2.3% |
| Immigrants | Western Asia | 2.6 /100 | #235 | Tragic 2.3% |
| Iraqis | 2.2 /100 | #236 | Tragic 2.4% |
| Immigrants | Eastern Asia | 2.0 /100 | #237 | Tragic 2.4% |
| Paiute | 1.9 /100 | #238 | Tragic 2.4% |
| Liberians | 1.8 /100 | #239 | Tragic 2.4% |
| Immigrants | Senegal | 1.7 /100 | #240 | Tragic 2.4% |
| Koreans | 1.7 /100 | #241 | Tragic 2.4% |