Immigrants from Zaire vs Nigerian No Schooling Completed
COMPARE
Immigrants from Zaire
Nigerian
No Schooling Completed
No Schooling Completed Comparison
Immigrants from Zaire
Nigerians
2.3%
NO SCHOOLING COMPLETED
7.2/ 100
METRIC RATING
215th/ 347
METRIC RANK
2.3%
NO SCHOOLING COMPLETED
2.6/ 100
METRIC RATING
234th/ 347
METRIC RANK
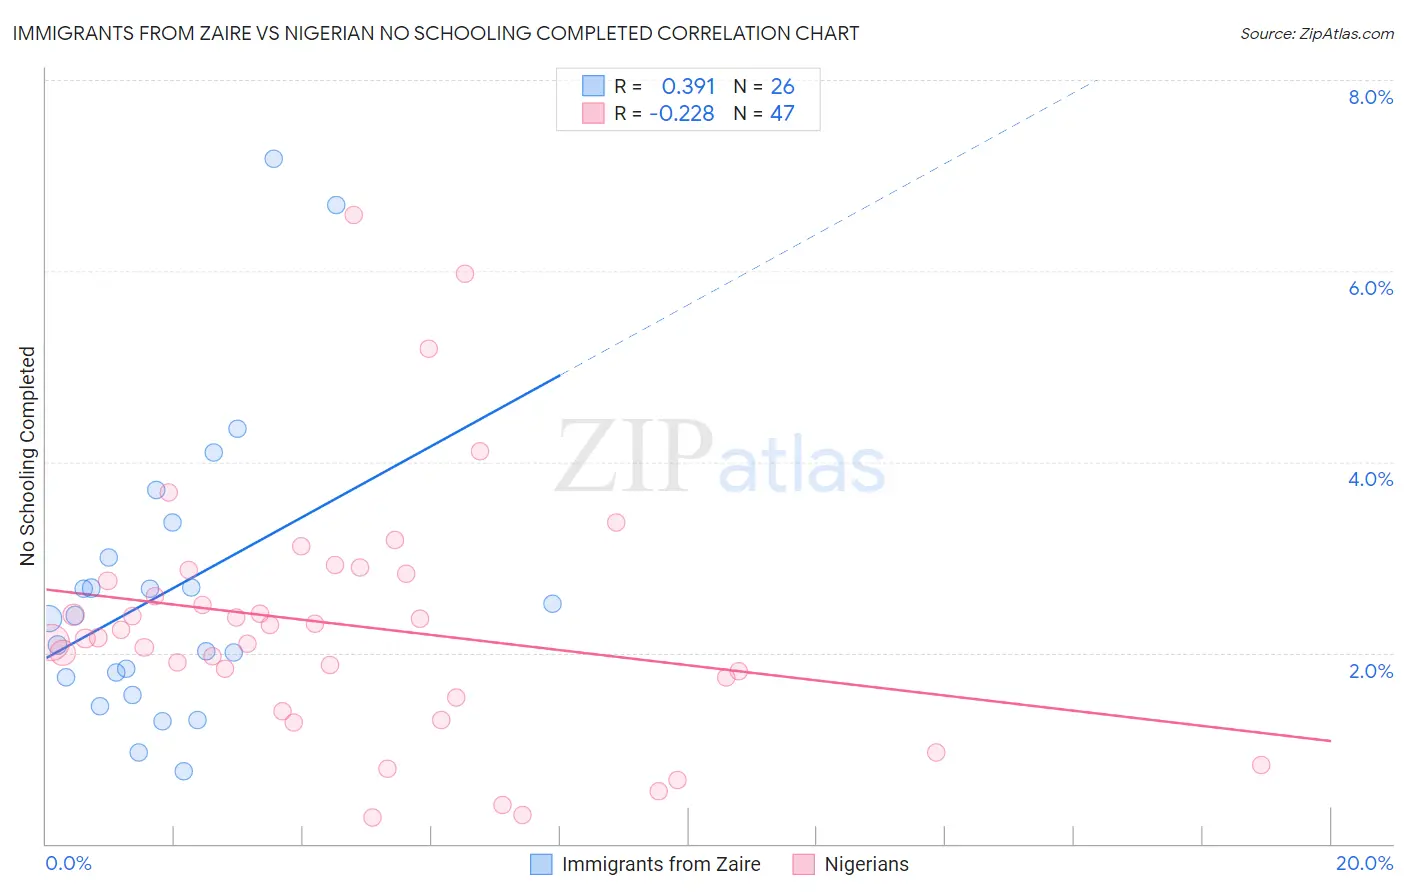
Immigrants from Zaire vs Nigerian No Schooling Completed Correlation Chart
The statistical analysis conducted on geographies consisting of 107,090,561 people shows a mild positive correlation between the proportion of Immigrants from Zaire and percentage of population with no schooling in the United States with a correlation coefficient (R) of 0.391 and weighted average of 2.3%. Similarly, the statistical analysis conducted on geographies consisting of 330,931,802 people shows a weak negative correlation between the proportion of Nigerians and percentage of population with no schooling in the United States with a correlation coefficient (R) of -0.228 and weighted average of 2.3%, a difference of 3.3%.
No Schooling Completed Correlation Summary
| Measurement | Immigrants from Zaire | Nigerian |
| Minimum | 0.76% | 0.27% |
| Maximum | 7.2% | 6.6% |
| Range | 6.4% | 6.3% |
| Mean | 2.7% | 2.3% |
| Median | 2.4% | 2.2% |
| Interquartile 25% (IQ1) | 1.7% | 1.5% |
| Interquartile 75% (IQ3) | 3.0% | 2.8% |
| Interquartile Range (IQR) | 1.3% | 1.3% |
| Standard Deviation (Sample) | 1.5% | 1.3% |
| Standard Deviation (Population) | 1.5% | 1.3% |
Demographics Similar to Immigrants from Zaire and Nigerians by No Schooling Completed
In terms of no schooling completed, the demographic groups most similar to Immigrants from Zaire are Tongan (2.3%, a difference of 0.20%), Immigrants from Syria (2.3%, a difference of 0.28%), Immigrants from Nepal (2.3%, a difference of 0.39%), Samoan (2.3%, a difference of 0.43%), and Senegalese (2.3%, a difference of 0.83%). Similarly, the demographic groups most similar to Nigerians are Immigrants from Malaysia (2.3%, a difference of 0.25%), Colombian (2.3%, a difference of 0.61%), Immigrants from Uruguay (2.3%, a difference of 0.83%), Puerto Rican (2.3%, a difference of 0.85%), and Immigrants from Pakistan (2.3%, a difference of 0.99%).
| Demographics | Rating | Rank | No Schooling Completed |
| Samoans | 8.2 /100 | #214 | Tragic 2.3% |
| Immigrants | Zaire | 7.2 /100 | #215 | Tragic 2.3% |
| Tongans | 6.8 /100 | #216 | Tragic 2.3% |
| Immigrants | Syria | 6.6 /100 | #217 | Tragic 2.3% |
| Immigrants | Nepal | 6.4 /100 | #218 | Tragic 2.3% |
| Senegalese | 5.6 /100 | #219 | Tragic 2.3% |
| Immigrants | Costa Rica | 5.1 /100 | #220 | Tragic 2.3% |
| Immigrants | Sudan | 5.0 /100 | #221 | Tragic 2.3% |
| Sub-Saharan Africans | 4.7 /100 | #222 | Tragic 2.3% |
| Immigrants | Lebanon | 4.5 /100 | #223 | Tragic 2.3% |
| Tohono O'odham | 4.1 /100 | #224 | Tragic 2.3% |
| Sudanese | 4.1 /100 | #225 | Tragic 2.3% |
| Sierra Leoneans | 4.1 /100 | #226 | Tragic 2.3% |
| Immigrants | Uganda | 4.0 /100 | #227 | Tragic 2.3% |
| U.S. Virgin Islanders | 3.7 /100 | #228 | Tragic 2.3% |
| Immigrants | Pakistan | 3.6 /100 | #229 | Tragic 2.3% |
| Puerto Ricans | 3.4 /100 | #230 | Tragic 2.3% |
| Immigrants | Uruguay | 3.4 /100 | #231 | Tragic 2.3% |
| Colombians | 3.2 /100 | #232 | Tragic 2.3% |
| Immigrants | Malaysia | 2.8 /100 | #233 | Tragic 2.3% |
| Nigerians | 2.6 /100 | #234 | Tragic 2.3% |