Czech vs Immigrants from Zaire No Schooling Completed
COMPARE
Czech
Immigrants from Zaire
No Schooling Completed
No Schooling Completed Comparison
Czechs
Immigrants from Zaire
1.5%
NO SCHOOLING COMPLETED
100.0/ 100
METRIC RATING
26th/ 347
METRIC RANK
2.3%
NO SCHOOLING COMPLETED
7.2/ 100
METRIC RATING
215th/ 347
METRIC RANK
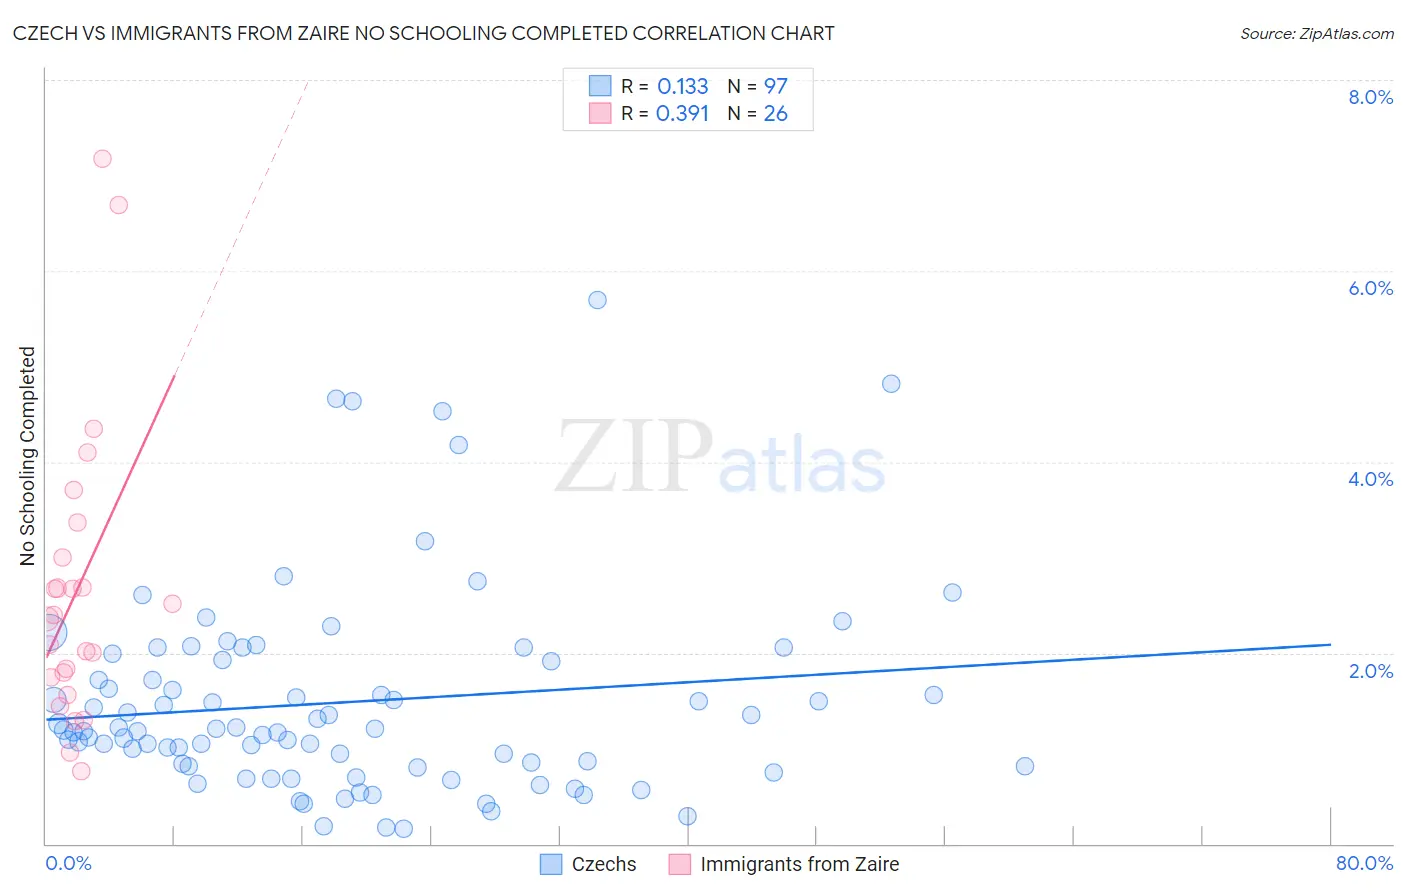
Czech vs Immigrants from Zaire No Schooling Completed Correlation Chart
The statistical analysis conducted on geographies consisting of 474,064,370 people shows a poor positive correlation between the proportion of Czechs and percentage of population with no schooling in the United States with a correlation coefficient (R) of 0.133 and weighted average of 1.5%. Similarly, the statistical analysis conducted on geographies consisting of 107,090,561 people shows a mild positive correlation between the proportion of Immigrants from Zaire and percentage of population with no schooling in the United States with a correlation coefficient (R) of 0.391 and weighted average of 2.3%, a difference of 52.2%.
No Schooling Completed Correlation Summary
| Measurement | Czech | Immigrants from Zaire |
| Minimum | 0.15% | 0.76% |
| Maximum | 5.7% | 7.2% |
| Range | 5.5% | 6.4% |
| Mean | 1.5% | 2.7% |
| Median | 1.2% | 2.4% |
| Interquartile 25% (IQ1) | 0.82% | 1.7% |
| Interquartile 75% (IQ3) | 1.9% | 3.0% |
| Interquartile Range (IQR) | 1.1% | 1.3% |
| Standard Deviation (Sample) | 1.1% | 1.5% |
| Standard Deviation (Population) | 1.1% | 1.5% |
Similar Demographics by No Schooling Completed
Demographics Similar to Czechs by No Schooling Completed
In terms of no schooling completed, the demographic groups most similar to Czechs are Scandinavian (1.5%, a difference of 0.53%), French Canadian (1.5%, a difference of 0.54%), French (1.5%, a difference of 0.59%), Pennsylvania German (1.5%, a difference of 0.61%), and European (1.5%, a difference of 0.96%).
| Demographics | Rating | Rank | No Schooling Completed |
| Alaskan Athabascans | 100.0 /100 | #19 | Exceptional 1.5% |
| Welsh | 100.0 /100 | #20 | Exceptional 1.5% |
| Chinese | 100.0 /100 | #21 | Exceptional 1.5% |
| Alaska Natives | 100.0 /100 | #22 | Exceptional 1.5% |
| Europeans | 100.0 /100 | #23 | Exceptional 1.5% |
| Pennsylvania Germans | 100.0 /100 | #24 | Exceptional 1.5% |
| French | 100.0 /100 | #25 | Exceptional 1.5% |
| Czechs | 100.0 /100 | #26 | Exceptional 1.5% |
| Scandinavians | 100.0 /100 | #27 | Exceptional 1.5% |
| French Canadians | 100.0 /100 | #28 | Exceptional 1.5% |
| Lumbee | 100.0 /100 | #29 | Exceptional 1.5% |
| British | 100.0 /100 | #30 | Exceptional 1.5% |
| Inupiat | 100.0 /100 | #31 | Exceptional 1.5% |
| Swiss | 100.0 /100 | #32 | Exceptional 1.5% |
| Italians | 100.0 /100 | #33 | Exceptional 1.5% |
Demographics Similar to Immigrants from Zaire by No Schooling Completed
In terms of no schooling completed, the demographic groups most similar to Immigrants from Zaire are Tongan (2.3%, a difference of 0.20%), Immigrants from Syria (2.3%, a difference of 0.28%), Immigrants from Nepal (2.3%, a difference of 0.39%), Samoan (2.3%, a difference of 0.43%), and Ute (2.3%, a difference of 0.47%).
| Demographics | Rating | Rank | No Schooling Completed |
| Uruguayans | 11.0 /100 | #208 | Poor 2.2% |
| Immigrants | Oceania | 10.2 /100 | #209 | Poor 2.2% |
| Natives/Alaskans | 10.0 /100 | #210 | Tragic 2.2% |
| Immigrants | Panama | 8.8 /100 | #211 | Tragic 2.3% |
| Immigrants | Morocco | 8.7 /100 | #212 | Tragic 2.3% |
| Ute | 8.2 /100 | #213 | Tragic 2.3% |
| Samoans | 8.2 /100 | #214 | Tragic 2.3% |
| Immigrants | Zaire | 7.2 /100 | #215 | Tragic 2.3% |
| Tongans | 6.8 /100 | #216 | Tragic 2.3% |
| Immigrants | Syria | 6.6 /100 | #217 | Tragic 2.3% |
| Immigrants | Nepal | 6.4 /100 | #218 | Tragic 2.3% |
| Senegalese | 5.6 /100 | #219 | Tragic 2.3% |
| Immigrants | Costa Rica | 5.1 /100 | #220 | Tragic 2.3% |
| Immigrants | Sudan | 5.0 /100 | #221 | Tragic 2.3% |
| Sub-Saharan Africans | 4.7 /100 | #222 | Tragic 2.3% |