Czech vs Immigrants from Hungary No Schooling Completed
COMPARE
Czech
Immigrants from Hungary
No Schooling Completed
No Schooling Completed Comparison
Czechs
Immigrants from Hungary
1.5%
NO SCHOOLING COMPLETED
100.0/ 100
METRIC RATING
26th/ 347
METRIC RANK
1.9%
NO SCHOOLING COMPLETED
91.6/ 100
METRIC RATING
131st/ 347
METRIC RANK
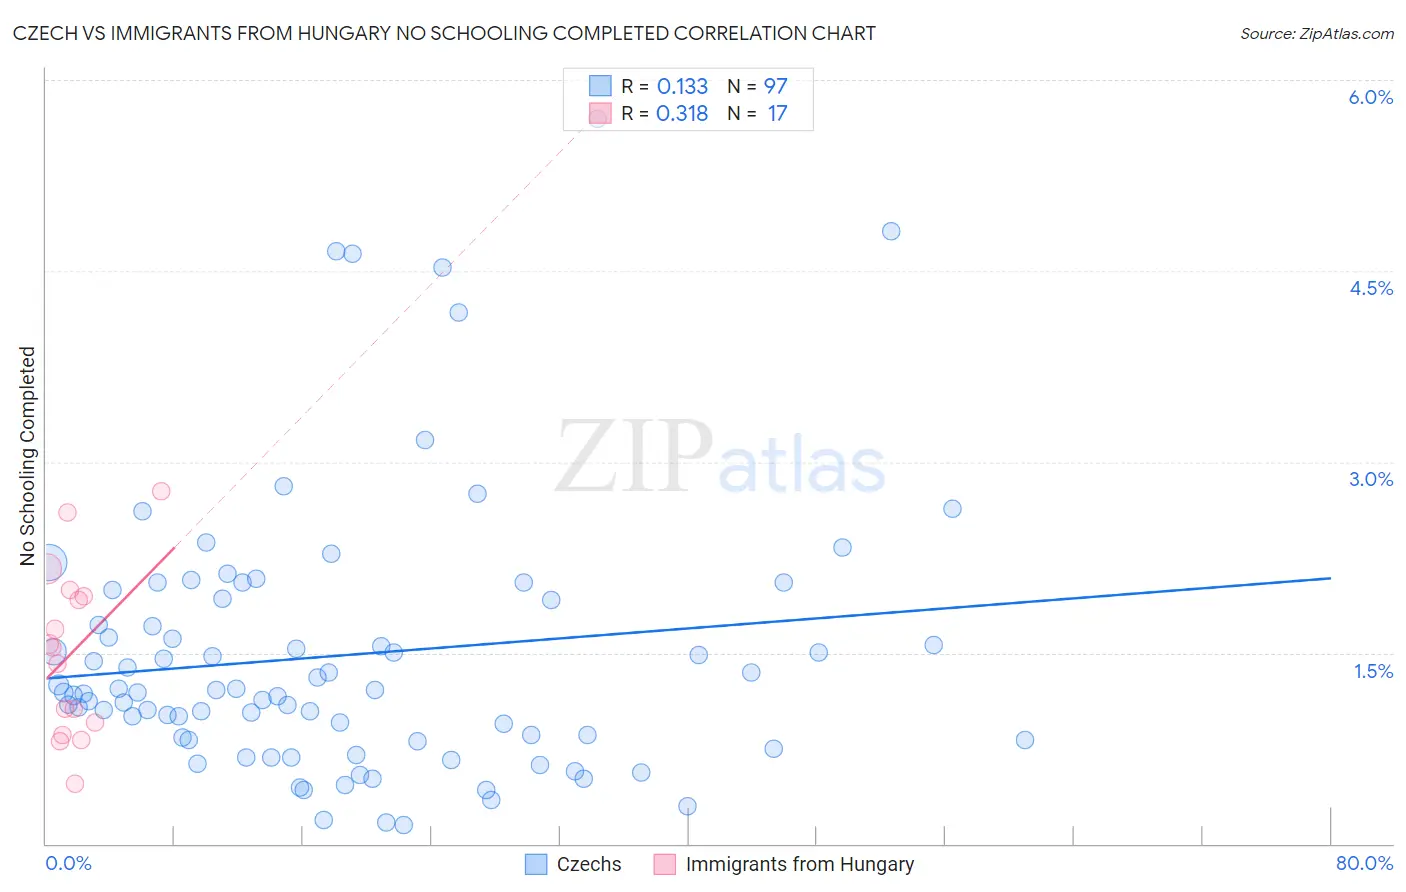
Czech vs Immigrants from Hungary No Schooling Completed Correlation Chart
The statistical analysis conducted on geographies consisting of 474,064,370 people shows a poor positive correlation between the proportion of Czechs and percentage of population with no schooling in the United States with a correlation coefficient (R) of 0.133 and weighted average of 1.5%. Similarly, the statistical analysis conducted on geographies consisting of 194,617,167 people shows a mild positive correlation between the proportion of Immigrants from Hungary and percentage of population with no schooling in the United States with a correlation coefficient (R) of 0.318 and weighted average of 1.9%, a difference of 28.9%.
No Schooling Completed Correlation Summary
| Measurement | Czech | Immigrants from Hungary |
| Minimum | 0.15% | 0.47% |
| Maximum | 5.7% | 2.8% |
| Range | 5.5% | 2.3% |
| Mean | 1.5% | 1.5% |
| Median | 1.2% | 1.5% |
| Interquartile 25% (IQ1) | 0.82% | 0.91% |
| Interquartile 75% (IQ3) | 1.9% | 2.0% |
| Interquartile Range (IQR) | 1.1% | 1.1% |
| Standard Deviation (Sample) | 1.1% | 0.66% |
| Standard Deviation (Population) | 1.1% | 0.64% |
Similar Demographics by No Schooling Completed
Demographics Similar to Czechs by No Schooling Completed
In terms of no schooling completed, the demographic groups most similar to Czechs are Scandinavian (1.5%, a difference of 0.53%), French Canadian (1.5%, a difference of 0.54%), French (1.5%, a difference of 0.59%), Pennsylvania German (1.5%, a difference of 0.61%), and European (1.5%, a difference of 0.96%).
| Demographics | Rating | Rank | No Schooling Completed |
| Alaskan Athabascans | 100.0 /100 | #19 | Exceptional 1.5% |
| Welsh | 100.0 /100 | #20 | Exceptional 1.5% |
| Chinese | 100.0 /100 | #21 | Exceptional 1.5% |
| Alaska Natives | 100.0 /100 | #22 | Exceptional 1.5% |
| Europeans | 100.0 /100 | #23 | Exceptional 1.5% |
| Pennsylvania Germans | 100.0 /100 | #24 | Exceptional 1.5% |
| French | 100.0 /100 | #25 | Exceptional 1.5% |
| Czechs | 100.0 /100 | #26 | Exceptional 1.5% |
| Scandinavians | 100.0 /100 | #27 | Exceptional 1.5% |
| French Canadians | 100.0 /100 | #28 | Exceptional 1.5% |
| Lumbee | 100.0 /100 | #29 | Exceptional 1.5% |
| British | 100.0 /100 | #30 | Exceptional 1.5% |
| Inupiat | 100.0 /100 | #31 | Exceptional 1.5% |
| Swiss | 100.0 /100 | #32 | Exceptional 1.5% |
| Italians | 100.0 /100 | #33 | Exceptional 1.5% |
Demographics Similar to Immigrants from Hungary by No Schooling Completed
In terms of no schooling completed, the demographic groups most similar to Immigrants from Hungary are Palestinian (1.9%, a difference of 0.11%), Seminole (1.9%, a difference of 0.21%), Spaniard (1.9%, a difference of 0.35%), Israeli (1.9%, a difference of 0.44%), and Colville (1.9%, a difference of 0.50%).
| Demographics | Rating | Rank | No Schooling Completed |
| Cambodians | 93.8 /100 | #124 | Exceptional 1.9% |
| Immigrants | Europe | 93.7 /100 | #125 | Exceptional 1.9% |
| Immigrants | Romania | 92.6 /100 | #126 | Exceptional 1.9% |
| Israelis | 92.4 /100 | #127 | Exceptional 1.9% |
| Spaniards | 92.3 /100 | #128 | Exceptional 1.9% |
| Seminole | 92.0 /100 | #129 | Exceptional 1.9% |
| Palestinians | 91.8 /100 | #130 | Exceptional 1.9% |
| Immigrants | Hungary | 91.6 /100 | #131 | Exceptional 1.9% |
| Colville | 90.4 /100 | #132 | Exceptional 1.9% |
| Immigrants | Turkey | 90.2 /100 | #133 | Exceptional 1.9% |
| Menominee | 89.6 /100 | #134 | Excellent 1.9% |
| Hmong | 88.5 /100 | #135 | Excellent 1.9% |
| Burmese | 88.2 /100 | #136 | Excellent 1.9% |
| Filipinos | 85.5 /100 | #137 | Excellent 2.0% |
| Immigrants | Israel | 85.4 /100 | #138 | Excellent 2.0% |