Czech vs Yakama No Schooling Completed
COMPARE
Czech
Yakama
No Schooling Completed
No Schooling Completed Comparison
Czechs
Yakama
1.5%
NO SCHOOLING COMPLETED
100.0/ 100
METRIC RATING
26th/ 347
METRIC RANK
3.6%
NO SCHOOLING COMPLETED
0.0/ 100
METRIC RATING
339th/ 347
METRIC RANK
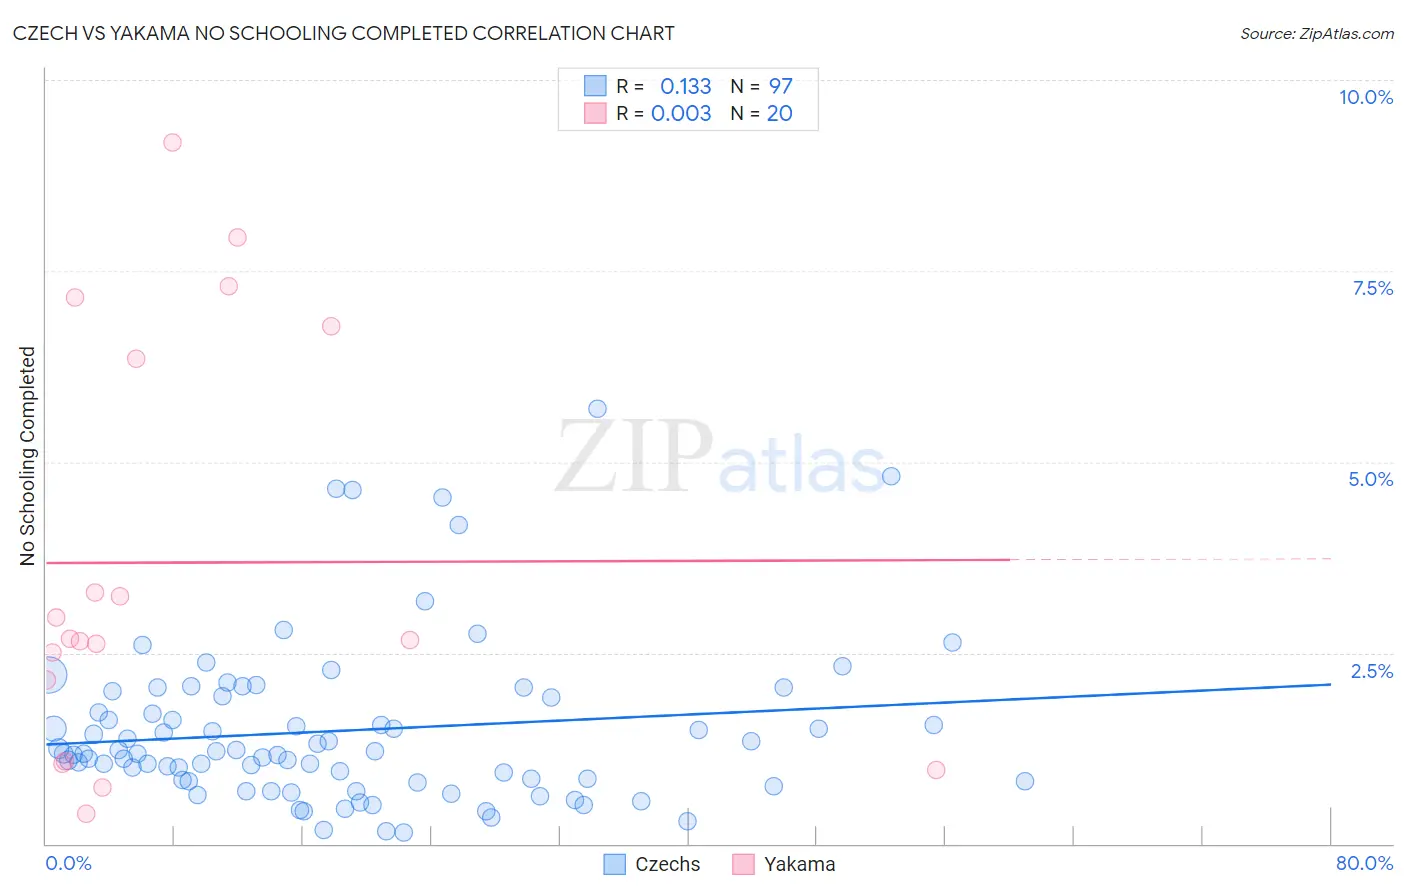
Czech vs Yakama No Schooling Completed Correlation Chart
The statistical analysis conducted on geographies consisting of 474,064,370 people shows a poor positive correlation between the proportion of Czechs and percentage of population with no schooling in the United States with a correlation coefficient (R) of 0.133 and weighted average of 1.5%. Similarly, the statistical analysis conducted on geographies consisting of 19,822,084 people shows no correlation between the proportion of Yakama and percentage of population with no schooling in the United States with a correlation coefficient (R) of 0.003 and weighted average of 3.6%, a difference of 138.1%.
No Schooling Completed Correlation Summary
| Measurement | Czech | Yakama |
| Minimum | 0.15% | 0.39% |
| Maximum | 5.7% | 9.2% |
| Range | 5.5% | 8.8% |
| Mean | 1.5% | 3.7% |
| Median | 1.2% | 2.7% |
| Interquartile 25% (IQ1) | 0.82% | 1.6% |
| Interquartile 75% (IQ3) | 1.9% | 6.6% |
| Interquartile Range (IQR) | 1.1% | 4.9% |
| Standard Deviation (Sample) | 1.1% | 2.7% |
| Standard Deviation (Population) | 1.1% | 2.6% |
Similar Demographics by No Schooling Completed
Demographics Similar to Czechs by No Schooling Completed
In terms of no schooling completed, the demographic groups most similar to Czechs are Scandinavian (1.5%, a difference of 0.53%), French Canadian (1.5%, a difference of 0.54%), French (1.5%, a difference of 0.59%), Pennsylvania German (1.5%, a difference of 0.61%), and European (1.5%, a difference of 0.96%).
| Demographics | Rating | Rank | No Schooling Completed |
| Alaskan Athabascans | 100.0 /100 | #19 | Exceptional 1.5% |
| Welsh | 100.0 /100 | #20 | Exceptional 1.5% |
| Chinese | 100.0 /100 | #21 | Exceptional 1.5% |
| Alaska Natives | 100.0 /100 | #22 | Exceptional 1.5% |
| Europeans | 100.0 /100 | #23 | Exceptional 1.5% |
| Pennsylvania Germans | 100.0 /100 | #24 | Exceptional 1.5% |
| French | 100.0 /100 | #25 | Exceptional 1.5% |
| Czechs | 100.0 /100 | #26 | Exceptional 1.5% |
| Scandinavians | 100.0 /100 | #27 | Exceptional 1.5% |
| French Canadians | 100.0 /100 | #28 | Exceptional 1.5% |
| Lumbee | 100.0 /100 | #29 | Exceptional 1.5% |
| British | 100.0 /100 | #30 | Exceptional 1.5% |
| Inupiat | 100.0 /100 | #31 | Exceptional 1.5% |
| Swiss | 100.0 /100 | #32 | Exceptional 1.5% |
| Italians | 100.0 /100 | #33 | Exceptional 1.5% |
Demographics Similar to Yakama by No Schooling Completed
In terms of no schooling completed, the demographic groups most similar to Yakama are Bangladeshi (3.5%, a difference of 0.31%), Immigrants from Cabo Verde (3.5%, a difference of 0.55%), Immigrants from Guatemala (3.6%, a difference of 0.68%), Immigrants from Fiji (3.5%, a difference of 1.3%), and Immigrants from Cambodia (3.5%, a difference of 1.6%).
| Demographics | Rating | Rank | No Schooling Completed |
| Central Americans | 0.0 /100 | #332 | Tragic 3.4% |
| Immigrants | Dominican Republic | 0.0 /100 | #333 | Tragic 3.4% |
| Guatemalans | 0.0 /100 | #334 | Tragic 3.5% |
| Immigrants | Cambodia | 0.0 /100 | #335 | Tragic 3.5% |
| Immigrants | Fiji | 0.0 /100 | #336 | Tragic 3.5% |
| Immigrants | Cabo Verde | 0.0 /100 | #337 | Tragic 3.5% |
| Bangladeshis | 0.0 /100 | #338 | Tragic 3.5% |
| Yakama | 0.0 /100 | #339 | Tragic 3.6% |
| Immigrants | Guatemala | 0.0 /100 | #340 | Tragic 3.6% |
| Immigrants | Central America | 0.0 /100 | #341 | Tragic 3.6% |
| Immigrants | Mexico | 0.0 /100 | #342 | Tragic 3.6% |
| Salvadorans | 0.0 /100 | #343 | Tragic 3.7% |
| Nepalese | 0.0 /100 | #344 | Tragic 3.8% |
| Immigrants | El Salvador | 0.0 /100 | #345 | Tragic 3.9% |
| Immigrants | Yemen | 0.0 /100 | #346 | Tragic 4.1% |