French Canadian vs Nigerian No Schooling Completed
COMPARE
French Canadian
Nigerian
No Schooling Completed
No Schooling Completed Comparison
French Canadians
Nigerians
1.5%
NO SCHOOLING COMPLETED
100.0/ 100
METRIC RATING
28th/ 347
METRIC RANK
2.3%
NO SCHOOLING COMPLETED
2.6/ 100
METRIC RATING
234th/ 347
METRIC RANK
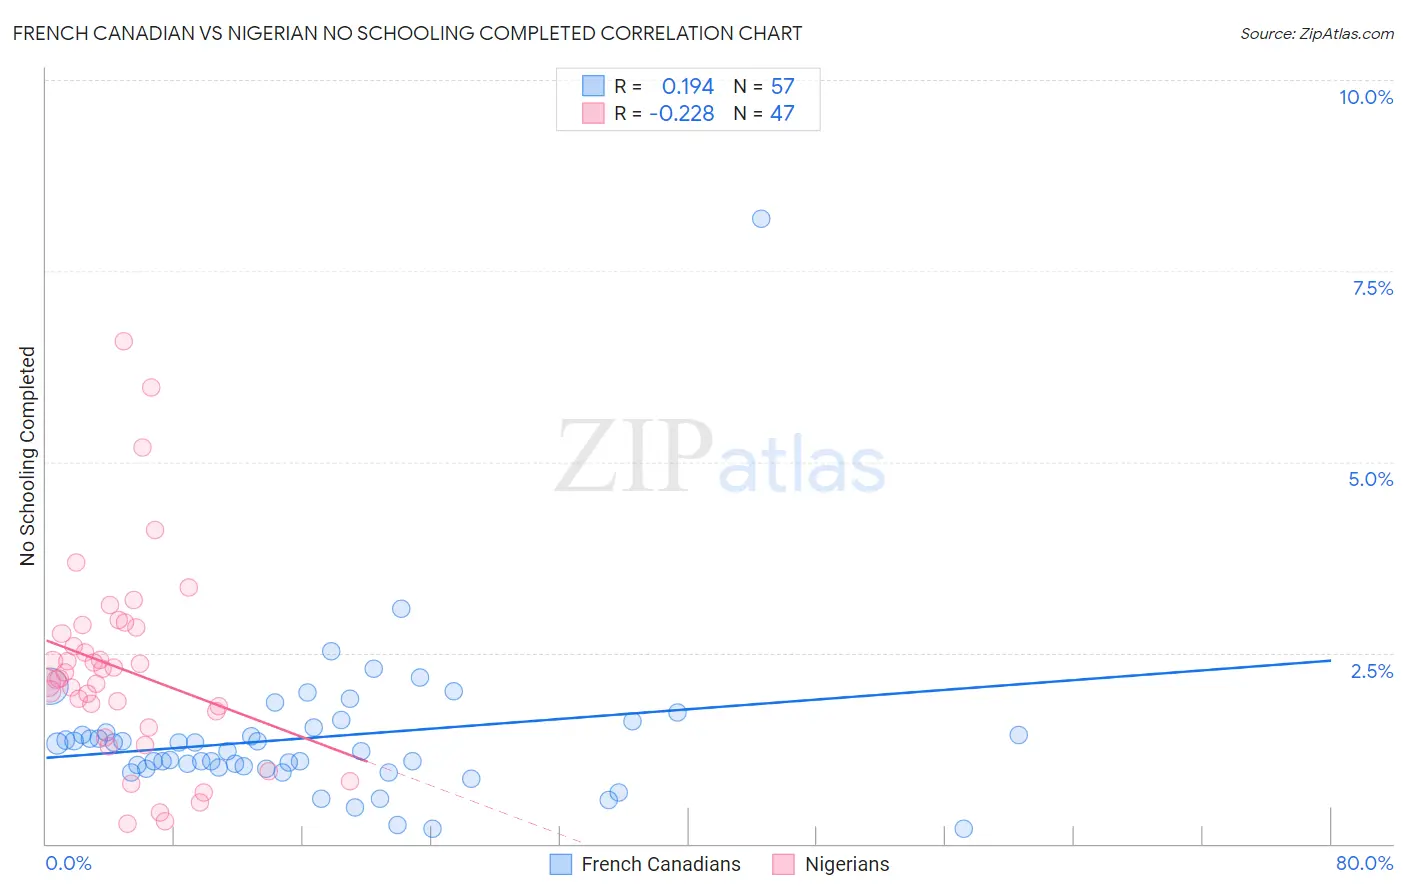
French Canadian vs Nigerian No Schooling Completed Correlation Chart
The statistical analysis conducted on geographies consisting of 491,496,199 people shows a poor positive correlation between the proportion of French Canadians and percentage of population with no schooling in the United States with a correlation coefficient (R) of 0.194 and weighted average of 1.5%. Similarly, the statistical analysis conducted on geographies consisting of 330,931,802 people shows a weak negative correlation between the proportion of Nigerians and percentage of population with no schooling in the United States with a correlation coefficient (R) of -0.228 and weighted average of 2.3%, a difference of 56.3%.
No Schooling Completed Correlation Summary
| Measurement | French Canadian | Nigerian |
| Minimum | 0.20% | 0.27% |
| Maximum | 8.2% | 6.6% |
| Range | 8.0% | 6.3% |
| Mean | 1.4% | 2.3% |
| Median | 1.2% | 2.2% |
| Interquartile 25% (IQ1) | 0.99% | 1.5% |
| Interquartile 75% (IQ3) | 1.5% | 2.8% |
| Interquartile Range (IQR) | 0.49% | 1.3% |
| Standard Deviation (Sample) | 1.1% | 1.3% |
| Standard Deviation (Population) | 1.1% | 1.3% |
Similar Demographics by No Schooling Completed
Demographics Similar to French Canadians by No Schooling Completed
In terms of no schooling completed, the demographic groups most similar to French Canadians are Scandinavian (1.5%, a difference of 0.010%), Czech (1.5%, a difference of 0.54%), Lumbee (1.5%, a difference of 0.91%), French (1.5%, a difference of 1.1%), and Pennsylvania German (1.5%, a difference of 1.1%).
| Demographics | Rating | Rank | No Schooling Completed |
| Chinese | 100.0 /100 | #21 | Exceptional 1.5% |
| Alaska Natives | 100.0 /100 | #22 | Exceptional 1.5% |
| Europeans | 100.0 /100 | #23 | Exceptional 1.5% |
| Pennsylvania Germans | 100.0 /100 | #24 | Exceptional 1.5% |
| French | 100.0 /100 | #25 | Exceptional 1.5% |
| Czechs | 100.0 /100 | #26 | Exceptional 1.5% |
| Scandinavians | 100.0 /100 | #27 | Exceptional 1.5% |
| French Canadians | 100.0 /100 | #28 | Exceptional 1.5% |
| Lumbee | 100.0 /100 | #29 | Exceptional 1.5% |
| British | 100.0 /100 | #30 | Exceptional 1.5% |
| Inupiat | 100.0 /100 | #31 | Exceptional 1.5% |
| Swiss | 100.0 /100 | #32 | Exceptional 1.5% |
| Italians | 100.0 /100 | #33 | Exceptional 1.5% |
| Latvians | 100.0 /100 | #34 | Exceptional 1.5% |
| Eastern Europeans | 100.0 /100 | #35 | Exceptional 1.6% |
Demographics Similar to Nigerians by No Schooling Completed
In terms of no schooling completed, the demographic groups most similar to Nigerians are Immigrants from Western Asia (2.3%, a difference of 0.020%), Immigrants from Malaysia (2.3%, a difference of 0.25%), Iraqi (2.4%, a difference of 0.56%), Colombian (2.3%, a difference of 0.61%), and Immigrants from Eastern Asia (2.4%, a difference of 0.76%).
| Demographics | Rating | Rank | No Schooling Completed |
| Immigrants | Uganda | 4.0 /100 | #227 | Tragic 2.3% |
| U.S. Virgin Islanders | 3.7 /100 | #228 | Tragic 2.3% |
| Immigrants | Pakistan | 3.6 /100 | #229 | Tragic 2.3% |
| Puerto Ricans | 3.4 /100 | #230 | Tragic 2.3% |
| Immigrants | Uruguay | 3.4 /100 | #231 | Tragic 2.3% |
| Colombians | 3.2 /100 | #232 | Tragic 2.3% |
| Immigrants | Malaysia | 2.8 /100 | #233 | Tragic 2.3% |
| Nigerians | 2.6 /100 | #234 | Tragic 2.3% |
| Immigrants | Western Asia | 2.6 /100 | #235 | Tragic 2.3% |
| Iraqis | 2.2 /100 | #236 | Tragic 2.4% |
| Immigrants | Eastern Asia | 2.0 /100 | #237 | Tragic 2.4% |
| Paiute | 1.9 /100 | #238 | Tragic 2.4% |
| Liberians | 1.8 /100 | #239 | Tragic 2.4% |
| Immigrants | Senegal | 1.7 /100 | #240 | Tragic 2.4% |
| Koreans | 1.7 /100 | #241 | Tragic 2.4% |