Czech vs German No Schooling Completed
COMPARE
Czech
German
No Schooling Completed
No Schooling Completed Comparison
Czechs
Germans
1.5%
NO SCHOOLING COMPLETED
100.0/ 100
METRIC RATING
26th/ 347
METRIC RANK
1.4%
NO SCHOOLING COMPLETED
100.0/ 100
METRIC RATING
4th/ 347
METRIC RANK
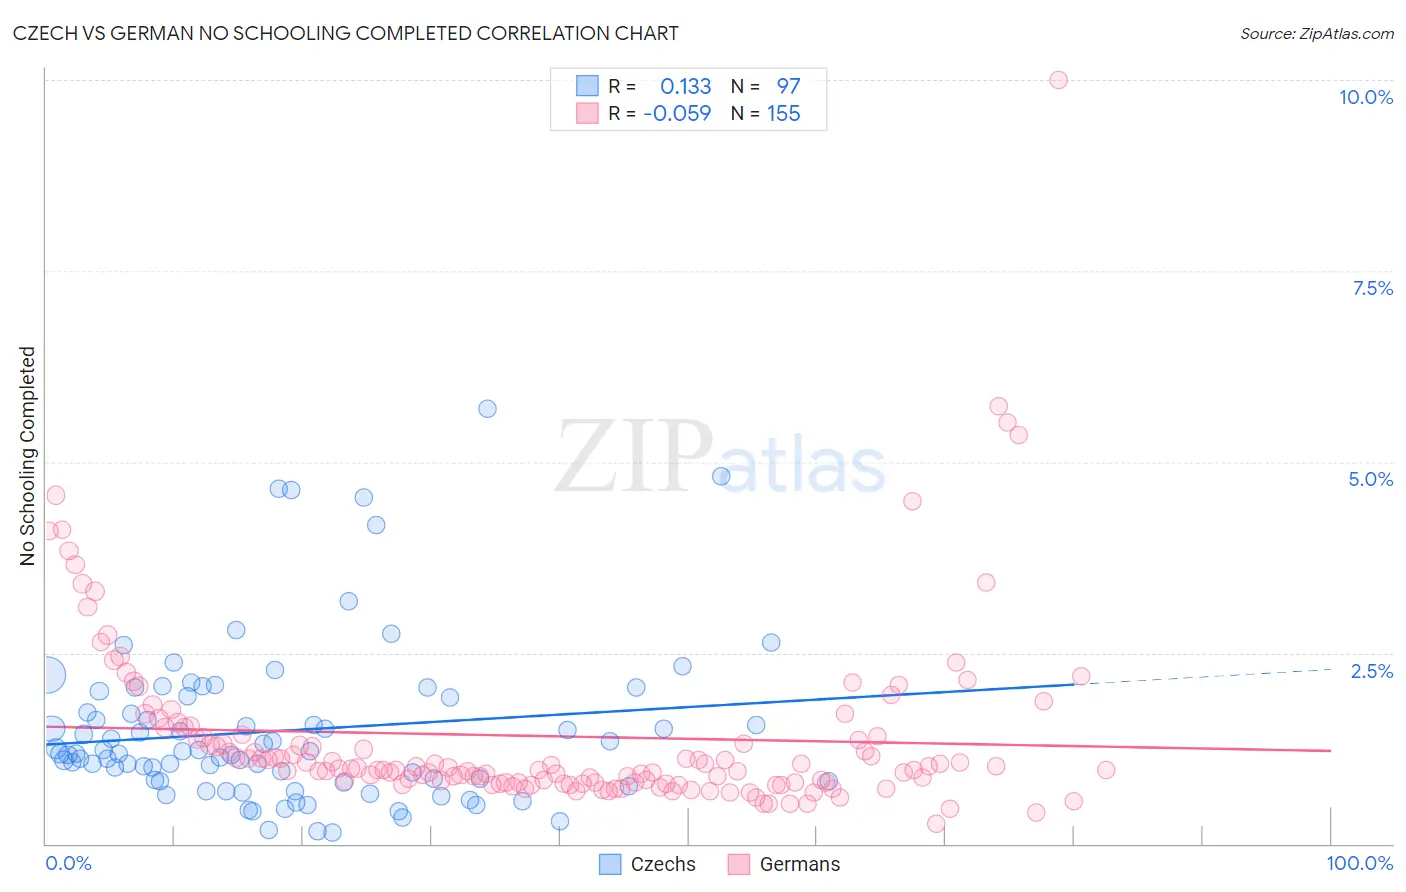
Czech vs German No Schooling Completed Correlation Chart
The statistical analysis conducted on geographies consisting of 474,064,370 people shows a poor positive correlation between the proportion of Czechs and percentage of population with no schooling in the United States with a correlation coefficient (R) of 0.133 and weighted average of 1.5%. Similarly, the statistical analysis conducted on geographies consisting of 559,407,426 people shows a slight negative correlation between the proportion of Germans and percentage of population with no schooling in the United States with a correlation coefficient (R) of -0.059 and weighted average of 1.4%, a difference of 10.1%.
No Schooling Completed Correlation Summary
| Measurement | Czech | German |
| Minimum | 0.15% | 0.26% |
| Maximum | 5.7% | 10.0% |
| Range | 5.5% | 9.7% |
| Mean | 1.5% | 1.4% |
| Median | 1.2% | 0.98% |
| Interquartile 25% (IQ1) | 0.82% | 0.80% |
| Interquartile 75% (IQ3) | 1.9% | 1.4% |
| Interquartile Range (IQR) | 1.1% | 0.61% |
| Standard Deviation (Sample) | 1.1% | 1.2% |
| Standard Deviation (Population) | 1.1% | 1.2% |
Similar Demographics by No Schooling Completed
Demographics Similar to Czechs by No Schooling Completed
In terms of no schooling completed, the demographic groups most similar to Czechs are Scandinavian (1.5%, a difference of 0.53%), French Canadian (1.5%, a difference of 0.54%), French (1.5%, a difference of 0.59%), Pennsylvania German (1.5%, a difference of 0.61%), and European (1.5%, a difference of 0.96%).
| Demographics | Rating | Rank | No Schooling Completed |
| Alaskan Athabascans | 100.0 /100 | #19 | Exceptional 1.5% |
| Welsh | 100.0 /100 | #20 | Exceptional 1.5% |
| Chinese | 100.0 /100 | #21 | Exceptional 1.5% |
| Alaska Natives | 100.0 /100 | #22 | Exceptional 1.5% |
| Europeans | 100.0 /100 | #23 | Exceptional 1.5% |
| Pennsylvania Germans | 100.0 /100 | #24 | Exceptional 1.5% |
| French | 100.0 /100 | #25 | Exceptional 1.5% |
| Czechs | 100.0 /100 | #26 | Exceptional 1.5% |
| Scandinavians | 100.0 /100 | #27 | Exceptional 1.5% |
| French Canadians | 100.0 /100 | #28 | Exceptional 1.5% |
| Lumbee | 100.0 /100 | #29 | Exceptional 1.5% |
| British | 100.0 /100 | #30 | Exceptional 1.5% |
| Inupiat | 100.0 /100 | #31 | Exceptional 1.5% |
| Swiss | 100.0 /100 | #32 | Exceptional 1.5% |
| Italians | 100.0 /100 | #33 | Exceptional 1.5% |
Demographics Similar to Germans by No Schooling Completed
In terms of no schooling completed, the demographic groups most similar to Germans are Slovene (1.4%, a difference of 0.42%), Norwegian (1.3%, a difference of 0.56%), Slovak (1.3%, a difference of 0.99%), Carpatho Rusyn (1.4%, a difference of 1.2%), and English (1.4%, a difference of 2.2%).
| Demographics | Rating | Rank | No Schooling Completed |
| Yup'ik | 100.0 /100 | #1 | Exceptional 1.2% |
| Slovaks | 100.0 /100 | #2 | Exceptional 1.3% |
| Norwegians | 100.0 /100 | #3 | Exceptional 1.3% |
| Germans | 100.0 /100 | #4 | Exceptional 1.4% |
| Slovenes | 100.0 /100 | #5 | Exceptional 1.4% |
| Carpatho Rusyns | 100.0 /100 | #6 | Exceptional 1.4% |
| English | 100.0 /100 | #7 | Exceptional 1.4% |
| Swedes | 100.0 /100 | #8 | Exceptional 1.4% |
| Scottish | 100.0 /100 | #9 | Exceptional 1.4% |
| Dutch | 100.0 /100 | #10 | Exceptional 1.4% |
| Lithuanians | 100.0 /100 | #11 | Exceptional 1.4% |
| Irish | 100.0 /100 | #12 | Exceptional 1.4% |
| Poles | 100.0 /100 | #13 | Exceptional 1.4% |
| Scotch-Irish | 100.0 /100 | #14 | Exceptional 1.5% |
| Tlingit-Haida | 100.0 /100 | #15 | Exceptional 1.5% |