Czech vs Nigerian 2 or more Vehicles in Household
COMPARE
Czech
Nigerian
2 or more Vehicles in Household
2 or more Vehicles in Household Comparison
Czechs
Nigerians
61.5%
2 OR MORE VEHICLES IN HOUSEHOLD
100.0/ 100
METRIC RATING
14th/ 347
METRIC RANK
52.8%
2 OR MORE VEHICLES IN HOUSEHOLD
0.9/ 100
METRIC RATING
253rd/ 347
METRIC RANK
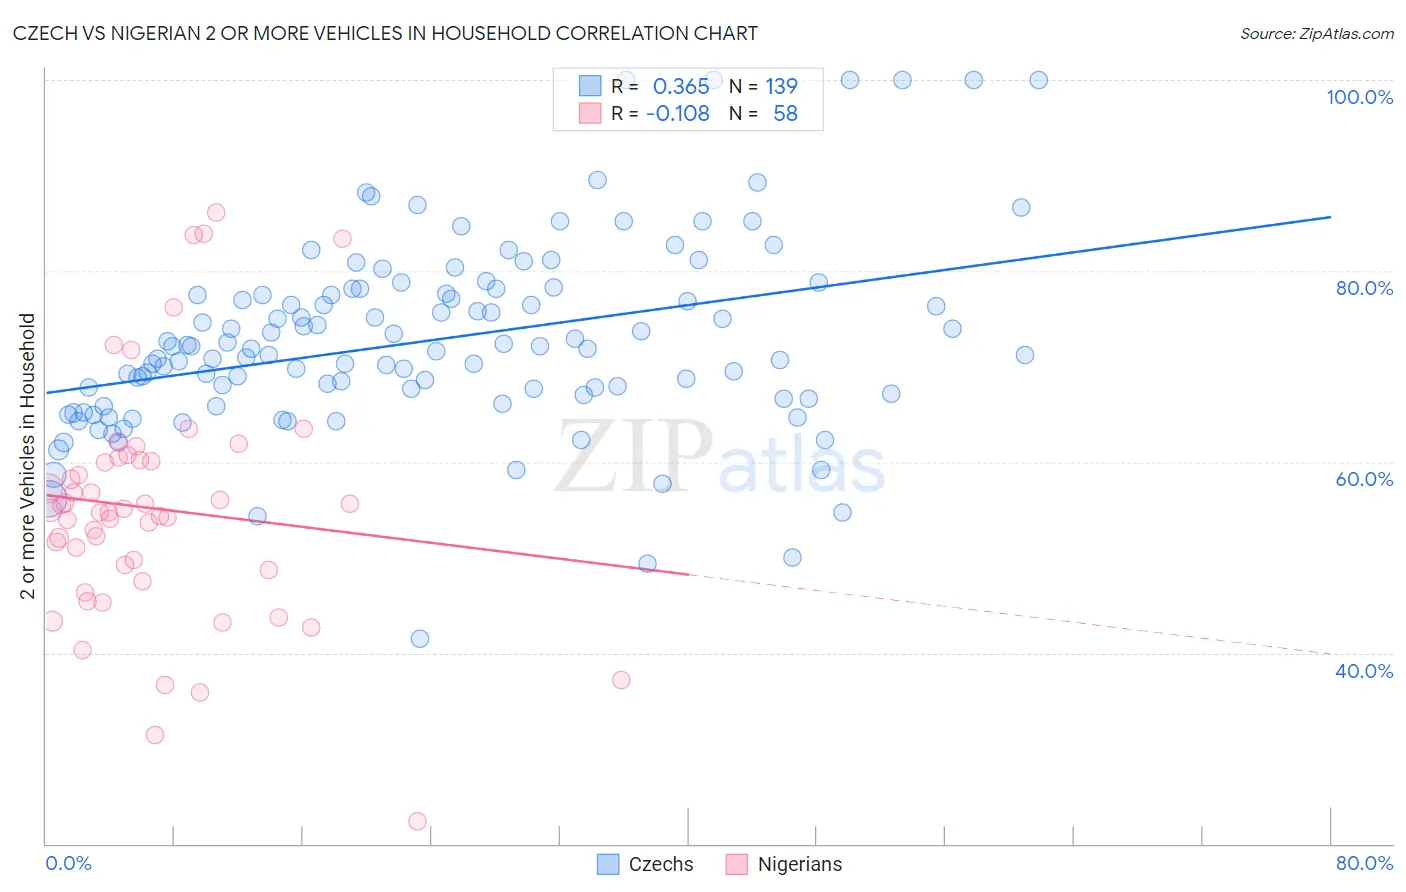
Czech vs Nigerian 2 or more Vehicles in Household Correlation Chart
The statistical analysis conducted on geographies consisting of 484,510,183 people shows a mild positive correlation between the proportion of Czechs and percentage of households with 2 or more vehicles available in the United States with a correlation coefficient (R) of 0.365 and weighted average of 61.5%. Similarly, the statistical analysis conducted on geographies consisting of 332,498,440 people shows a poor negative correlation between the proportion of Nigerians and percentage of households with 2 or more vehicles available in the United States with a correlation coefficient (R) of -0.108 and weighted average of 52.8%, a difference of 16.5%.
2 or more Vehicles in Household Correlation Summary
| Measurement | Czech | Nigerian |
| Minimum | 41.5% | 22.3% |
| Maximum | 100.0% | 86.1% |
| Range | 58.5% | 63.8% |
| Mean | 72.7% | 55.1% |
| Median | 71.8% | 54.8% |
| Interquartile 25% (IQ1) | 66.7% | 48.7% |
| Interquartile 75% (IQ3) | 77.6% | 60.2% |
| Interquartile Range (IQR) | 10.9% | 11.5% |
| Standard Deviation (Sample) | 10.1% | 12.4% |
| Standard Deviation (Population) | 10.0% | 12.3% |
Similar Demographics by 2 or more Vehicles in Household
Demographics Similar to Czechs by 2 or more Vehicles in Household
In terms of 2 or more vehicles in household, the demographic groups most similar to Czechs are Samoan (61.5%, a difference of 0.050%), Nepalese (61.4%, a difference of 0.090%), Native Hawaiian (61.4%, a difference of 0.11%), German (61.6%, a difference of 0.16%), and Basque (61.4%, a difference of 0.18%).
| Demographics | Rating | Rank | 2 or more Vehicles in Household |
| Puget Sound Salish | 100.0 /100 | #7 | Exceptional 62.1% |
| English | 100.0 /100 | #8 | Exceptional 61.9% |
| Swedes | 100.0 /100 | #9 | Exceptional 61.8% |
| Mexicans | 100.0 /100 | #10 | Exceptional 61.7% |
| Dutch | 100.0 /100 | #11 | Exceptional 61.6% |
| Germans | 100.0 /100 | #12 | Exceptional 61.6% |
| Samoans | 100.0 /100 | #13 | Exceptional 61.5% |
| Czechs | 100.0 /100 | #14 | Exceptional 61.5% |
| Nepalese | 100.0 /100 | #15 | Exceptional 61.4% |
| Native Hawaiians | 100.0 /100 | #16 | Exceptional 61.4% |
| Basques | 100.0 /100 | #17 | Exceptional 61.4% |
| Europeans | 100.0 /100 | #18 | Exceptional 61.4% |
| Scottish | 100.0 /100 | #19 | Exceptional 61.2% |
| Sri Lankans | 100.0 /100 | #20 | Exceptional 61.0% |
| Koreans | 100.0 /100 | #21 | Exceptional 61.0% |
Demographics Similar to Nigerians by 2 or more Vehicles in Household
In terms of 2 or more vehicles in household, the demographic groups most similar to Nigerians are Immigrants from Portugal (52.8%, a difference of 0.050%), Immigrants from Sudan (52.8%, a difference of 0.060%), Immigrants from Brazil (52.8%, a difference of 0.10%), Mongolian (52.8%, a difference of 0.10%), and Colombian (52.9%, a difference of 0.15%).
| Demographics | Rating | Rank | 2 or more Vehicles in Household |
| Immigrants | Nigeria | 1.2 /100 | #246 | Tragic 52.9% |
| Sierra Leoneans | 1.2 /100 | #247 | Tragic 52.9% |
| Colombians | 1.1 /100 | #248 | Tragic 52.9% |
| Immigrants | Brazil | 1.0 /100 | #249 | Tragic 52.8% |
| Mongolians | 1.0 /100 | #250 | Tragic 52.8% |
| Immigrants | Sudan | 1.0 /100 | #251 | Tragic 52.8% |
| Immigrants | Portugal | 1.0 /100 | #252 | Tragic 52.8% |
| Nigerians | 0.9 /100 | #253 | Tragic 52.8% |
| Immigrants | Malaysia | 0.8 /100 | #254 | Tragic 52.7% |
| Uruguayans | 0.7 /100 | #255 | Tragic 52.7% |
| Immigrants | Eritrea | 0.7 /100 | #256 | Tragic 52.6% |
| Immigrants | Hong Kong | 0.6 /100 | #257 | Tragic 52.6% |
| Central American Indians | 0.6 /100 | #258 | Tragic 52.5% |
| Alsatians | 0.6 /100 | #259 | Tragic 52.5% |
| Immigrants | Bahamas | 0.5 /100 | #260 | Tragic 52.5% |