Tsimshian vs Nigerian No Schooling Completed
COMPARE
Tsimshian
Nigerian
No Schooling Completed
No Schooling Completed Comparison
Tsimshian
Nigerians
1.7%
NO SCHOOLING COMPLETED
99.8/ 100
METRIC RATING
61st/ 347
METRIC RANK
2.3%
NO SCHOOLING COMPLETED
2.6/ 100
METRIC RATING
234th/ 347
METRIC RANK
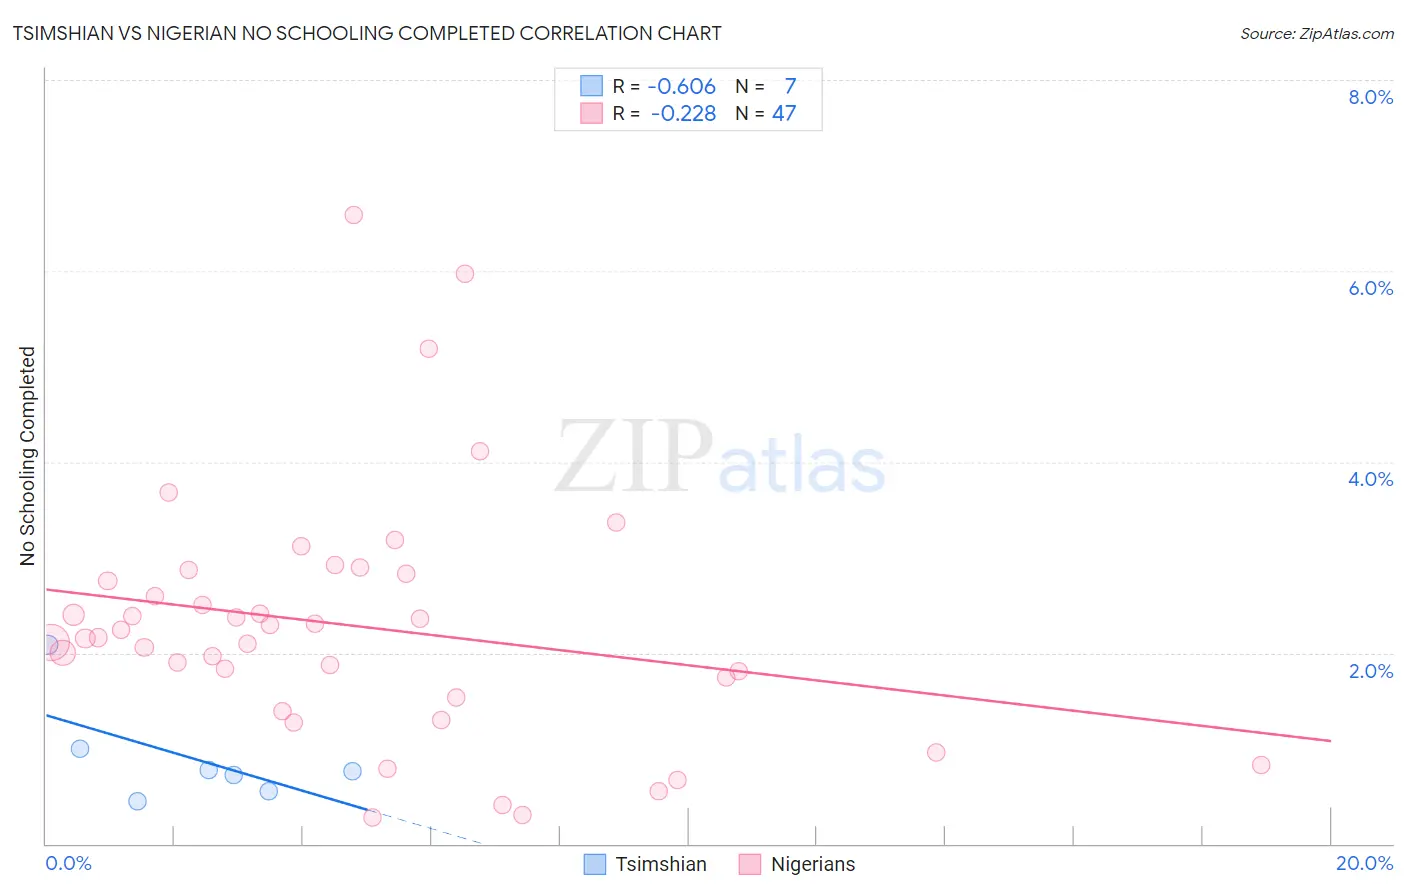
Tsimshian vs Nigerian No Schooling Completed Correlation Chart
The statistical analysis conducted on geographies consisting of 15,573,780 people shows a significant negative correlation between the proportion of Tsimshian and percentage of population with no schooling in the United States with a correlation coefficient (R) of -0.606 and weighted average of 1.7%. Similarly, the statistical analysis conducted on geographies consisting of 330,931,802 people shows a weak negative correlation between the proportion of Nigerians and percentage of population with no schooling in the United States with a correlation coefficient (R) of -0.228 and weighted average of 2.3%, a difference of 41.5%.
No Schooling Completed Correlation Summary
| Measurement | Tsimshian | Nigerian |
| Minimum | 0.44% | 0.27% |
| Maximum | 2.1% | 6.6% |
| Range | 1.6% | 6.3% |
| Mean | 0.90% | 2.3% |
| Median | 0.76% | 2.2% |
| Interquartile 25% (IQ1) | 0.55% | 1.5% |
| Interquartile 75% (IQ3) | 1.00% | 2.8% |
| Interquartile Range (IQR) | 0.45% | 1.3% |
| Standard Deviation (Sample) | 0.55% | 1.3% |
| Standard Deviation (Population) | 0.51% | 1.3% |
Similar Demographics by No Schooling Completed
Demographics Similar to Tsimshian by No Schooling Completed
In terms of no schooling completed, the demographic groups most similar to Tsimshian are American (1.7%, a difference of 0.29%), Slavic (1.7%, a difference of 0.42%), Kiowa (1.6%, a difference of 0.49%), Immigrants from Northern Europe (1.7%, a difference of 0.63%), and Austrian (1.6%, a difference of 0.64%).
| Demographics | Rating | Rank | No Schooling Completed |
| Crow | 99.8 /100 | #54 | Exceptional 1.6% |
| Greeks | 99.8 /100 | #55 | Exceptional 1.6% |
| Immigrants | North America | 99.8 /100 | #56 | Exceptional 1.6% |
| Austrians | 99.8 /100 | #57 | Exceptional 1.6% |
| Kiowa | 99.8 /100 | #58 | Exceptional 1.6% |
| Slavs | 99.8 /100 | #59 | Exceptional 1.7% |
| Americans | 99.8 /100 | #60 | Exceptional 1.7% |
| Tsimshian | 99.8 /100 | #61 | Exceptional 1.7% |
| Immigrants | Northern Europe | 99.8 /100 | #62 | Exceptional 1.7% |
| Russians | 99.8 /100 | #63 | Exceptional 1.7% |
| New Zealanders | 99.7 /100 | #64 | Exceptional 1.7% |
| Serbians | 99.7 /100 | #65 | Exceptional 1.7% |
| Canadians | 99.7 /100 | #66 | Exceptional 1.7% |
| Immigrants | Austria | 99.7 /100 | #67 | Exceptional 1.7% |
| Immigrants | Lithuania | 99.7 /100 | #68 | Exceptional 1.7% |
Demographics Similar to Nigerians by No Schooling Completed
In terms of no schooling completed, the demographic groups most similar to Nigerians are Immigrants from Western Asia (2.3%, a difference of 0.020%), Immigrants from Malaysia (2.3%, a difference of 0.25%), Iraqi (2.4%, a difference of 0.56%), Colombian (2.3%, a difference of 0.61%), and Immigrants from Eastern Asia (2.4%, a difference of 0.76%).
| Demographics | Rating | Rank | No Schooling Completed |
| Immigrants | Uganda | 4.0 /100 | #227 | Tragic 2.3% |
| U.S. Virgin Islanders | 3.7 /100 | #228 | Tragic 2.3% |
| Immigrants | Pakistan | 3.6 /100 | #229 | Tragic 2.3% |
| Puerto Ricans | 3.4 /100 | #230 | Tragic 2.3% |
| Immigrants | Uruguay | 3.4 /100 | #231 | Tragic 2.3% |
| Colombians | 3.2 /100 | #232 | Tragic 2.3% |
| Immigrants | Malaysia | 2.8 /100 | #233 | Tragic 2.3% |
| Nigerians | 2.6 /100 | #234 | Tragic 2.3% |
| Immigrants | Western Asia | 2.6 /100 | #235 | Tragic 2.3% |
| Iraqis | 2.2 /100 | #236 | Tragic 2.4% |
| Immigrants | Eastern Asia | 2.0 /100 | #237 | Tragic 2.4% |
| Paiute | 1.9 /100 | #238 | Tragic 2.4% |
| Liberians | 1.8 /100 | #239 | Tragic 2.4% |
| Immigrants | Senegal | 1.7 /100 | #240 | Tragic 2.4% |
| Koreans | 1.7 /100 | #241 | Tragic 2.4% |