Czechoslovakian vs Crow GED/Equivalency
COMPARE
Czechoslovakian
Crow
GED/Equivalency
GED/Equivalency Comparison
Czechoslovakians
Crow
87.4%
GED/EQUIVALENCY
97.6/ 100
METRIC RATING
96th/ 347
METRIC RANK
83.8%
GED/EQUIVALENCY
1.1/ 100
METRIC RATING
249th/ 347
METRIC RANK
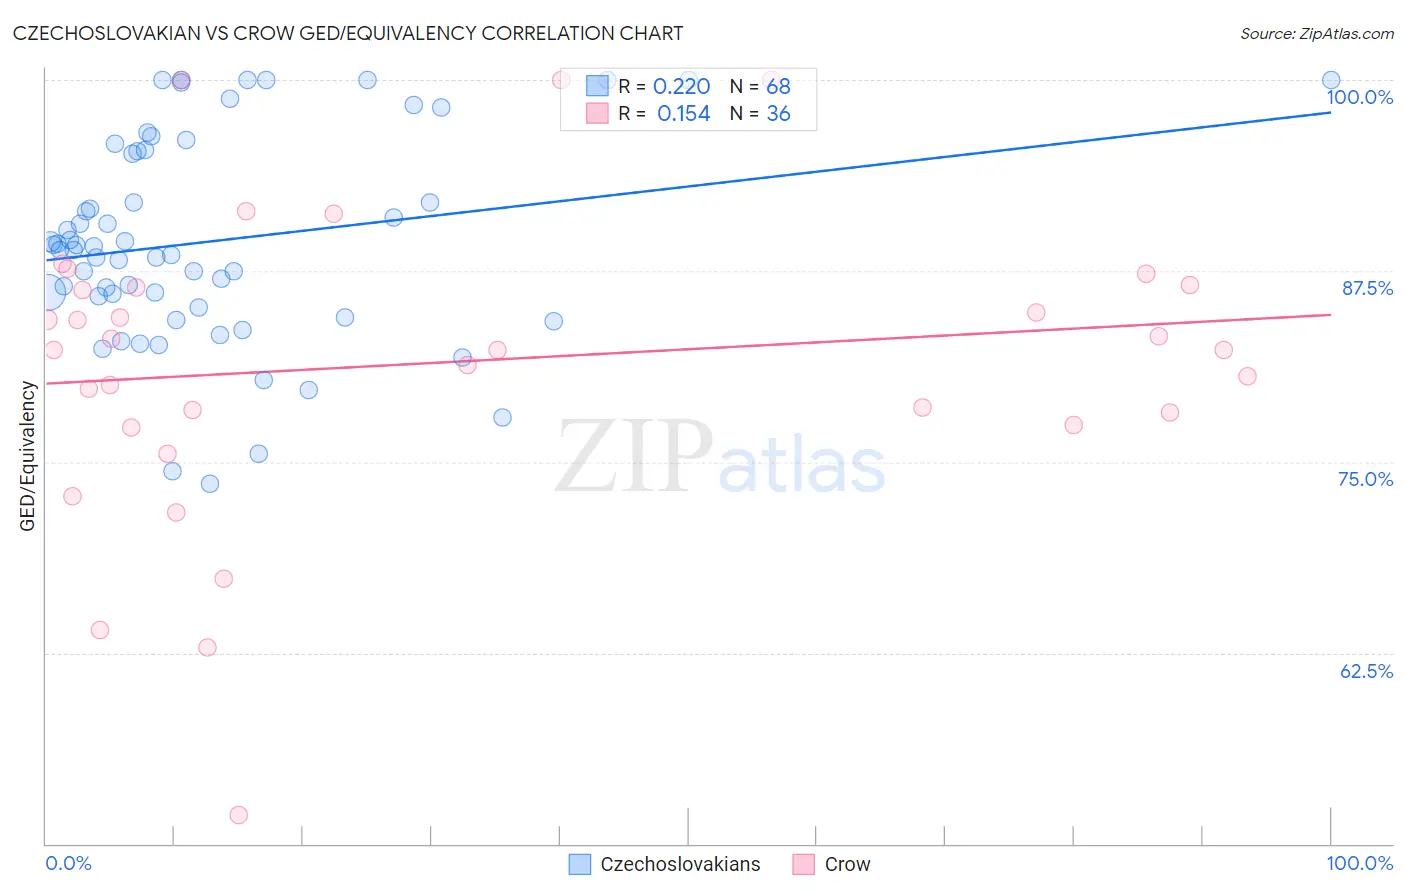
Czechoslovakian vs Crow GED/Equivalency Correlation Chart
The statistical analysis conducted on geographies consisting of 368,668,598 people shows a weak positive correlation between the proportion of Czechoslovakians and percentage of population with at least ged/equivalency education in the United States with a correlation coefficient (R) of 0.220 and weighted average of 87.4%. Similarly, the statistical analysis conducted on geographies consisting of 59,209,980 people shows a poor positive correlation between the proportion of Crow and percentage of population with at least ged/equivalency education in the United States with a correlation coefficient (R) of 0.154 and weighted average of 83.8%, a difference of 4.3%.
GED/Equivalency Correlation Summary
| Measurement | Czechoslovakian | Crow |
| Minimum | 73.5% | 51.9% |
| Maximum | 100.0% | 100.0% |
| Range | 26.5% | 48.1% |
| Mean | 89.5% | 81.5% |
| Median | 89.0% | 82.3% |
| Interquartile 25% (IQ1) | 85.5% | 77.9% |
| Interquartile 75% (IQ3) | 95.4% | 86.5% |
| Interquartile Range (IQR) | 9.9% | 8.6% |
| Standard Deviation (Sample) | 6.7% | 9.9% |
| Standard Deviation (Population) | 6.7% | 9.8% |
Similar Demographics by GED/Equivalency
Demographics Similar to Czechoslovakians by GED/Equivalency
In terms of ged/equivalency, the demographic groups most similar to Czechoslovakians are Immigrants from Greece (87.4%, a difference of 0.020%), Immigrants from Russia (87.4%, a difference of 0.030%), Israeli (87.4%, a difference of 0.040%), Immigrants from North Macedonia (87.4%, a difference of 0.040%), and Hungarian (87.4%, a difference of 0.060%).
| Demographics | Rating | Rank | GED/Equivalency |
| Hungarians | 97.9 /100 | #89 | Exceptional 87.4% |
| Welsh | 97.9 /100 | #90 | Exceptional 87.4% |
| Immigrants | Eastern Asia | 97.9 /100 | #91 | Exceptional 87.4% |
| Israelis | 97.8 /100 | #92 | Exceptional 87.4% |
| Immigrants | North Macedonia | 97.8 /100 | #93 | Exceptional 87.4% |
| Immigrants | Russia | 97.8 /100 | #94 | Exceptional 87.4% |
| Immigrants | Greece | 97.7 /100 | #95 | Exceptional 87.4% |
| Czechoslovakians | 97.6 /100 | #96 | Exceptional 87.4% |
| Immigrants | Western Europe | 97.3 /100 | #97 | Exceptional 87.3% |
| Immigrants | Croatia | 96.9 /100 | #98 | Exceptional 87.3% |
| Immigrants | Belarus | 96.9 /100 | #99 | Exceptional 87.3% |
| Palestinians | 96.8 /100 | #100 | Exceptional 87.3% |
| Syrians | 96.6 /100 | #101 | Exceptional 87.2% |
| Lebanese | 96.2 /100 | #102 | Exceptional 87.2% |
| Jordanians | 96.1 /100 | #103 | Exceptional 87.2% |
Demographics Similar to Crow by GED/Equivalency
In terms of ged/equivalency, the demographic groups most similar to Crow are Blackfeet (83.8%, a difference of 0.010%), Immigrants from Western Africa (83.8%, a difference of 0.020%), Shoshone (83.7%, a difference of 0.020%), Chickasaw (83.8%, a difference of 0.050%), and Immigrants from Senegal (83.8%, a difference of 0.080%).
| Demographics | Rating | Rank | GED/Equivalency |
| Sri Lankans | 1.9 /100 | #242 | Tragic 84.0% |
| Cherokee | 1.3 /100 | #243 | Tragic 83.9% |
| Immigrants | Ghana | 1.3 /100 | #244 | Tragic 83.9% |
| Immigrants | Senegal | 1.2 /100 | #245 | Tragic 83.8% |
| Chickasaw | 1.2 /100 | #246 | Tragic 83.8% |
| Immigrants | Western Africa | 1.1 /100 | #247 | Tragic 83.8% |
| Blackfeet | 1.1 /100 | #248 | Tragic 83.8% |
| Crow | 1.1 /100 | #249 | Tragic 83.8% |
| Shoshone | 1.0 /100 | #250 | Tragic 83.7% |
| Spanish Americans | 0.8 /100 | #251 | Tragic 83.6% |
| Bahamians | 0.8 /100 | #252 | Tragic 83.6% |
| Comanche | 0.7 /100 | #253 | Tragic 83.6% |
| Creek | 0.7 /100 | #254 | Tragic 83.6% |
| Colville | 0.5 /100 | #255 | Tragic 83.4% |
| Africans | 0.5 /100 | #256 | Tragic 83.4% |