Czechoslovakian vs Somali No Schooling Completed
COMPARE
Czechoslovakian
Somali
No Schooling Completed
No Schooling Completed Comparison
Czechoslovakians
Somalis
1.6%
NO SCHOOLING COMPLETED
99.9/ 100
METRIC RATING
45th/ 347
METRIC RANK
2.9%
NO SCHOOLING COMPLETED
0.0/ 100
METRIC RATING
303rd/ 347
METRIC RANK
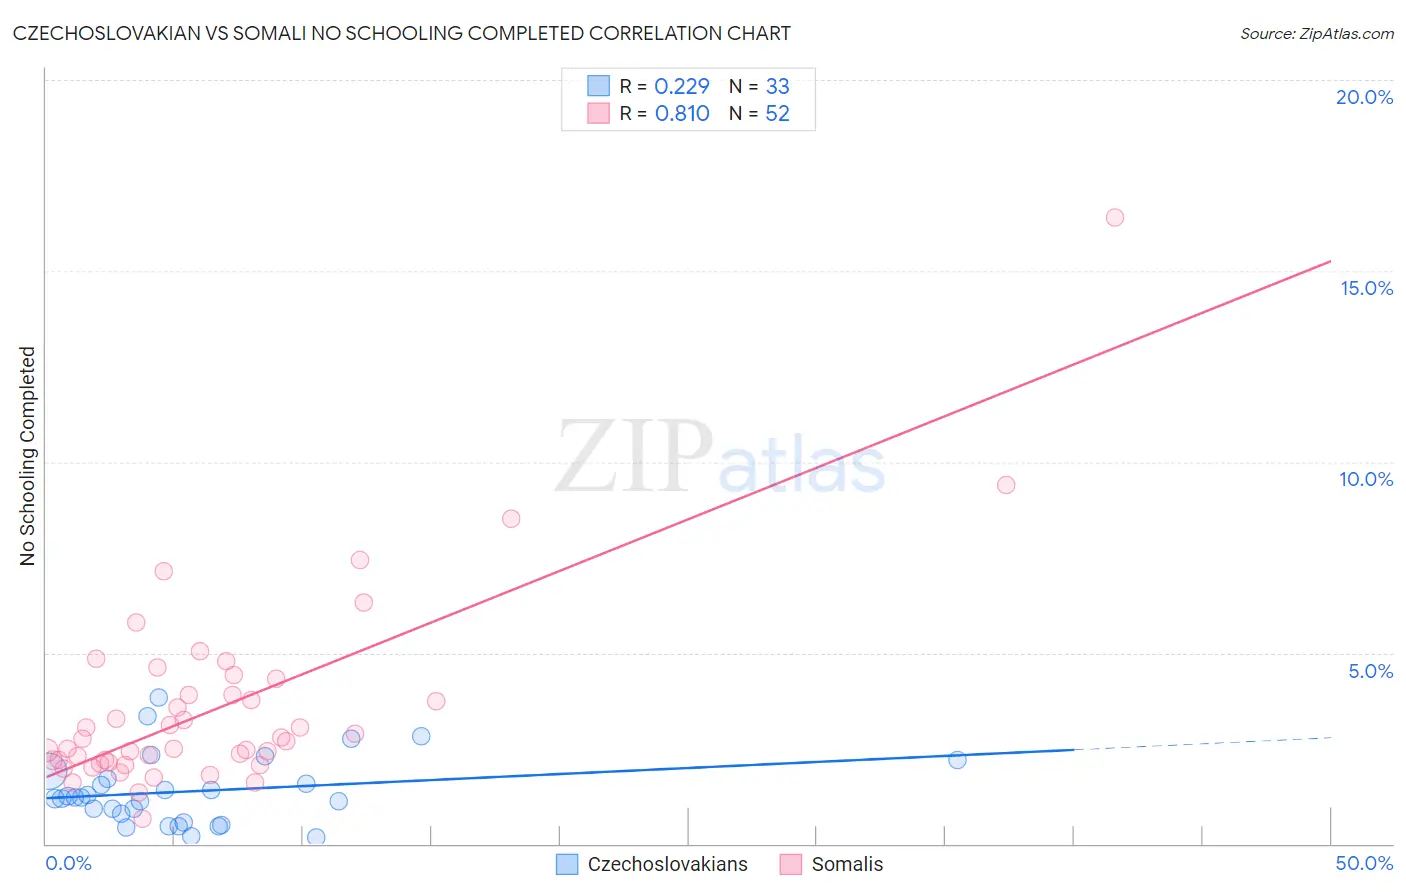
Czechoslovakian vs Somali No Schooling Completed Correlation Chart
The statistical analysis conducted on geographies consisting of 363,588,440 people shows a weak positive correlation between the proportion of Czechoslovakians and percentage of population with no schooling in the United States with a correlation coefficient (R) of 0.229 and weighted average of 1.6%. Similarly, the statistical analysis conducted on geographies consisting of 99,157,968 people shows a very strong positive correlation between the proportion of Somalis and percentage of population with no schooling in the United States with a correlation coefficient (R) of 0.810 and weighted average of 2.9%, a difference of 81.1%.
No Schooling Completed Correlation Summary
| Measurement | Czechoslovakian | Somali |
| Minimum | 0.16% | 0.66% |
| Maximum | 3.8% | 16.4% |
| Range | 3.7% | 15.8% |
| Mean | 1.4% | 3.6% |
| Median | 1.2% | 2.7% |
| Interquartile 25% (IQ1) | 0.67% | 2.2% |
| Interquartile 75% (IQ3) | 1.8% | 4.1% |
| Interquartile Range (IQR) | 1.1% | 2.0% |
| Standard Deviation (Sample) | 0.89% | 2.6% |
| Standard Deviation (Population) | 0.88% | 2.5% |
Similar Demographics by No Schooling Completed
Demographics Similar to Czechoslovakians by No Schooling Completed
In terms of no schooling completed, the demographic groups most similar to Czechoslovakians are Estonian (1.6%, a difference of 0.040%), Maltese (1.6%, a difference of 0.090%), Australian (1.6%, a difference of 0.23%), Ottawa (1.6%, a difference of 0.24%), and Bulgarian (1.6%, a difference of 0.35%).
| Demographics | Rating | Rank | No Schooling Completed |
| Northern Europeans | 99.9 /100 | #38 | Exceptional 1.6% |
| Native Hawaiians | 99.9 /100 | #39 | Exceptional 1.6% |
| Luxembourgers | 99.9 /100 | #40 | Exceptional 1.6% |
| Hungarians | 99.9 /100 | #41 | Exceptional 1.6% |
| Bulgarians | 99.9 /100 | #42 | Exceptional 1.6% |
| Australians | 99.9 /100 | #43 | Exceptional 1.6% |
| Estonians | 99.9 /100 | #44 | Exceptional 1.6% |
| Czechoslovakians | 99.9 /100 | #45 | Exceptional 1.6% |
| Maltese | 99.9 /100 | #46 | Exceptional 1.6% |
| Ottawa | 99.9 /100 | #47 | Exceptional 1.6% |
| Immigrants | Scotland | 99.9 /100 | #48 | Exceptional 1.6% |
| Whites/Caucasians | 99.9 /100 | #49 | Exceptional 1.6% |
| Celtics | 99.9 /100 | #50 | Exceptional 1.6% |
| Chippewa | 99.8 /100 | #51 | Exceptional 1.6% |
| Immigrants | Canada | 99.8 /100 | #52 | Exceptional 1.6% |
Demographics Similar to Somalis by No Schooling Completed
In terms of no schooling completed, the demographic groups most similar to Somalis are Nicaraguan (2.9%, a difference of 0.19%), Ecuadorian (3.0%, a difference of 0.66%), Immigrants from Caribbean (2.9%, a difference of 0.99%), Immigrants from South Eastern Asia (2.9%, a difference of 1.4%), and Belizean (3.0%, a difference of 2.3%).
| Demographics | Rating | Rank | No Schooling Completed |
| Immigrants | Immigrants | 0.0 /100 | #296 | Tragic 2.8% |
| Immigrants | Cuba | 0.0 /100 | #297 | Tragic 2.8% |
| Immigrants | Dominica | 0.0 /100 | #298 | Tragic 2.8% |
| Central American Indians | 0.0 /100 | #299 | Tragic 2.8% |
| Haitians | 0.0 /100 | #300 | Tragic 2.9% |
| Immigrants | South Eastern Asia | 0.0 /100 | #301 | Tragic 2.9% |
| Immigrants | Caribbean | 0.0 /100 | #302 | Tragic 2.9% |
| Somalis | 0.0 /100 | #303 | Tragic 2.9% |
| Nicaraguans | 0.0 /100 | #304 | Tragic 2.9% |
| Ecuadorians | 0.0 /100 | #305 | Tragic 3.0% |
| Belizeans | 0.0 /100 | #306 | Tragic 3.0% |
| Immigrants | Haiti | 0.0 /100 | #307 | Tragic 3.0% |
| Immigrants | Somalia | 0.0 /100 | #308 | Tragic 3.0% |
| Hispanics or Latinos | 0.0 /100 | #309 | Tragic 3.0% |
| Guyanese | 0.0 /100 | #310 | Tragic 3.0% |