Czechoslovakian vs Eastern European No Schooling Completed
COMPARE
Czechoslovakian
Eastern European
No Schooling Completed
No Schooling Completed Comparison
Czechoslovakians
Eastern Europeans
1.6%
NO SCHOOLING COMPLETED
99.9/ 100
METRIC RATING
45th/ 347
METRIC RANK
1.6%
NO SCHOOLING COMPLETED
100.0/ 100
METRIC RATING
35th/ 347
METRIC RANK
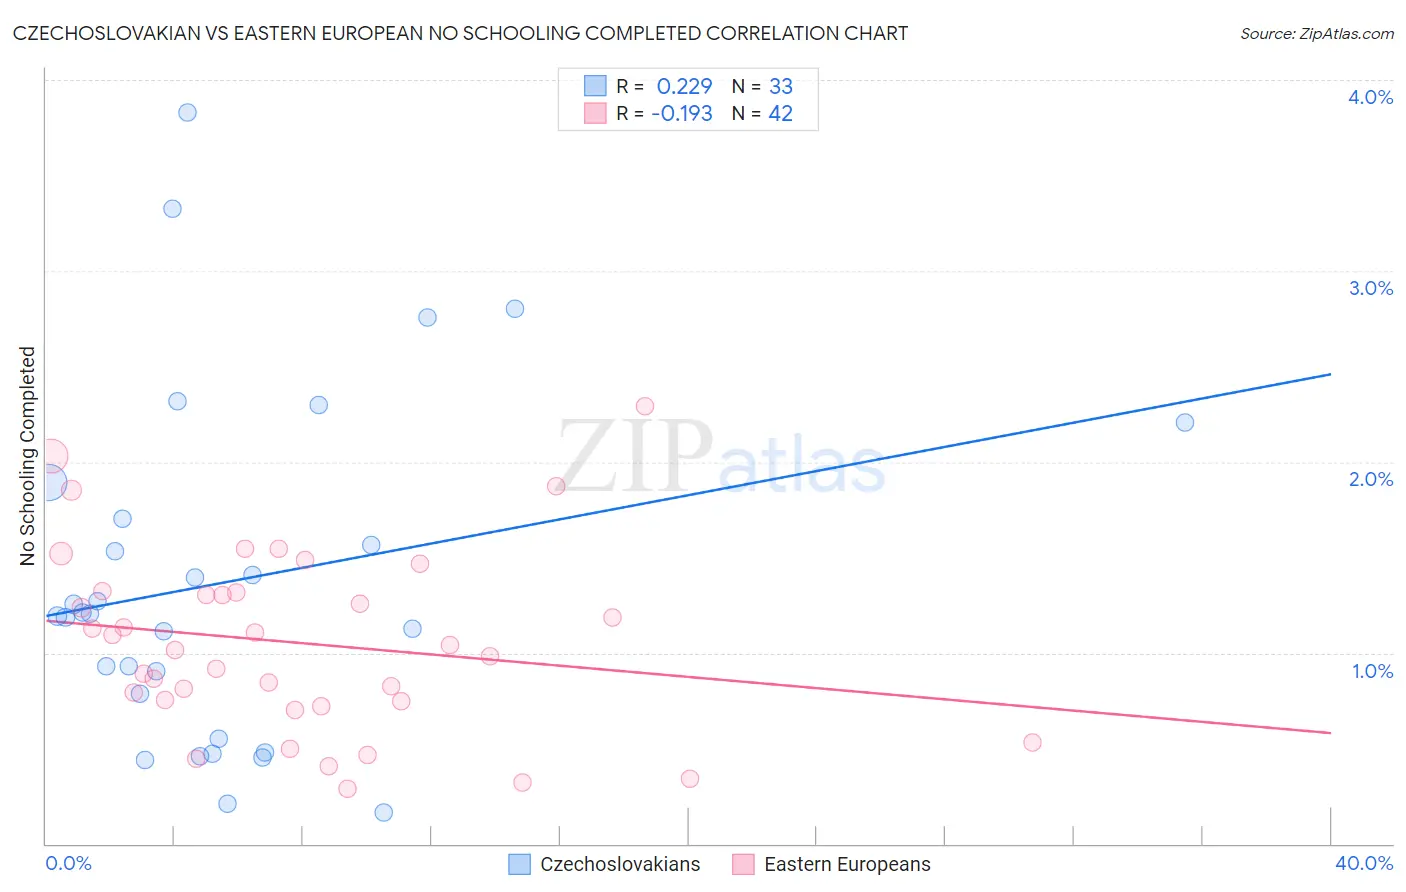
Czechoslovakian vs Eastern European No Schooling Completed Correlation Chart
The statistical analysis conducted on geographies consisting of 363,588,440 people shows a weak positive correlation between the proportion of Czechoslovakians and percentage of population with no schooling in the United States with a correlation coefficient (R) of 0.229 and weighted average of 1.6%. Similarly, the statistical analysis conducted on geographies consisting of 452,907,345 people shows a poor negative correlation between the proportion of Eastern Europeans and percentage of population with no schooling in the United States with a correlation coefficient (R) of -0.193 and weighted average of 1.6%, a difference of 4.2%.
No Schooling Completed Correlation Summary
| Measurement | Czechoslovakian | Eastern European |
| Minimum | 0.16% | 0.29% |
| Maximum | 3.8% | 2.3% |
| Range | 3.7% | 2.0% |
| Mean | 1.4% | 1.1% |
| Median | 1.2% | 1.0% |
| Interquartile 25% (IQ1) | 0.67% | 0.74% |
| Interquartile 75% (IQ3) | 1.8% | 1.3% |
| Interquartile Range (IQR) | 1.1% | 0.57% |
| Standard Deviation (Sample) | 0.89% | 0.48% |
| Standard Deviation (Population) | 0.88% | 0.47% |
Demographics Similar to Czechoslovakians and Eastern Europeans by No Schooling Completed
In terms of no schooling completed, the demographic groups most similar to Czechoslovakians are Estonian (1.6%, a difference of 0.040%), Maltese (1.6%, a difference of 0.090%), Australian (1.6%, a difference of 0.23%), Ottawa (1.6%, a difference of 0.24%), and Bulgarian (1.6%, a difference of 0.35%). Similarly, the demographic groups most similar to Eastern Europeans are Latvian (1.5%, a difference of 0.95%), Aleut (1.6%, a difference of 1.0%), Italian (1.5%, a difference of 1.2%), Belgian (1.6%, a difference of 1.3%), and Northern European (1.6%, a difference of 1.4%).
| Demographics | Rating | Rank | No Schooling Completed |
| British | 100.0 /100 | #30 | Exceptional 1.5% |
| Inupiat | 100.0 /100 | #31 | Exceptional 1.5% |
| Swiss | 100.0 /100 | #32 | Exceptional 1.5% |
| Italians | 100.0 /100 | #33 | Exceptional 1.5% |
| Latvians | 100.0 /100 | #34 | Exceptional 1.5% |
| Eastern Europeans | 100.0 /100 | #35 | Exceptional 1.6% |
| Aleuts | 99.9 /100 | #36 | Exceptional 1.6% |
| Belgians | 99.9 /100 | #37 | Exceptional 1.6% |
| Northern Europeans | 99.9 /100 | #38 | Exceptional 1.6% |
| Native Hawaiians | 99.9 /100 | #39 | Exceptional 1.6% |
| Luxembourgers | 99.9 /100 | #40 | Exceptional 1.6% |
| Hungarians | 99.9 /100 | #41 | Exceptional 1.6% |
| Bulgarians | 99.9 /100 | #42 | Exceptional 1.6% |
| Australians | 99.9 /100 | #43 | Exceptional 1.6% |
| Estonians | 99.9 /100 | #44 | Exceptional 1.6% |
| Czechoslovakians | 99.9 /100 | #45 | Exceptional 1.6% |
| Maltese | 99.9 /100 | #46 | Exceptional 1.6% |
| Ottawa | 99.9 /100 | #47 | Exceptional 1.6% |
| Immigrants | Scotland | 99.9 /100 | #48 | Exceptional 1.6% |
| Whites/Caucasians | 99.9 /100 | #49 | Exceptional 1.6% |
| Celtics | 99.9 /100 | #50 | Exceptional 1.6% |