Cypriot vs Immigrants from Taiwan No Schooling Completed
COMPARE
Cypriot
Immigrants from Taiwan
No Schooling Completed
No Schooling Completed Comparison
Cypriots
Immigrants from Taiwan
1.7%
NO SCHOOLING COMPLETED
99.3/ 100
METRIC RATING
80th/ 347
METRIC RANK
2.1%
NO SCHOOLING COMPLETED
42.6/ 100
METRIC RATING
181st/ 347
METRIC RANK
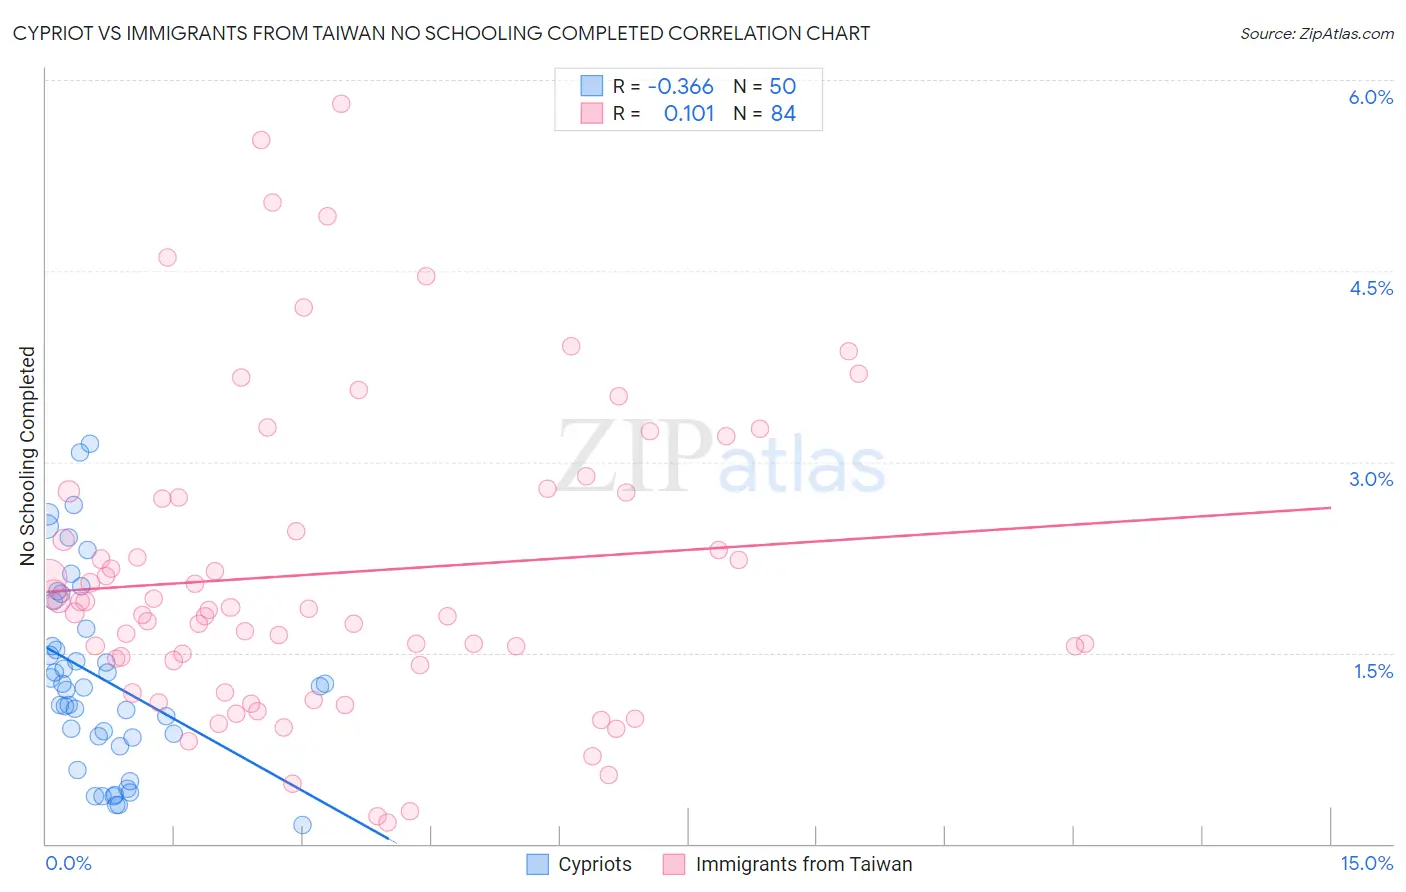
Cypriot vs Immigrants from Taiwan No Schooling Completed Correlation Chart
The statistical analysis conducted on geographies consisting of 61,760,973 people shows a mild negative correlation between the proportion of Cypriots and percentage of population with no schooling in the United States with a correlation coefficient (R) of -0.366 and weighted average of 1.7%. Similarly, the statistical analysis conducted on geographies consisting of 295,749,298 people shows a poor positive correlation between the proportion of Immigrants from Taiwan and percentage of population with no schooling in the United States with a correlation coefficient (R) of 0.101 and weighted average of 2.1%, a difference of 21.1%.
No Schooling Completed Correlation Summary
| Measurement | Cypriot | Immigrants from Taiwan |
| Minimum | 0.14% | 0.16% |
| Maximum | 3.1% | 5.8% |
| Range | 3.0% | 5.7% |
| Mean | 1.3% | 2.1% |
| Median | 1.2% | 1.8% |
| Interquartile 25% (IQ1) | 0.84% | 1.4% |
| Interquartile 75% (IQ3) | 1.7% | 2.7% |
| Interquartile Range (IQR) | 0.85% | 1.3% |
| Standard Deviation (Sample) | 0.75% | 1.2% |
| Standard Deviation (Population) | 0.74% | 1.2% |
Similar Demographics by No Schooling Completed
Demographics Similar to Cypriots by No Schooling Completed
In terms of no schooling completed, the demographic groups most similar to Cypriots are Macedonian (1.7%, a difference of 0.010%), Icelander (1.7%, a difference of 0.040%), Delaware (1.7%, a difference of 0.090%), Immigrants from Sweden (1.7%, a difference of 0.13%), and Immigrants from South Africa (1.7%, a difference of 0.13%).
| Demographics | Rating | Rank | No Schooling Completed |
| Immigrants | India | 99.4 /100 | #73 | Exceptional 1.7% |
| Zimbabweans | 99.4 /100 | #74 | Exceptional 1.7% |
| Immigrants | Belgium | 99.3 /100 | #75 | Exceptional 1.7% |
| Cherokee | 99.3 /100 | #76 | Exceptional 1.7% |
| Immigrants | Sweden | 99.3 /100 | #77 | Exceptional 1.7% |
| Delaware | 99.3 /100 | #78 | Exceptional 1.7% |
| Macedonians | 99.3 /100 | #79 | Exceptional 1.7% |
| Cypriots | 99.3 /100 | #80 | Exceptional 1.7% |
| Icelanders | 99.3 /100 | #81 | Exceptional 1.7% |
| Immigrants | South Africa | 99.3 /100 | #82 | Exceptional 1.7% |
| Potawatomi | 99.3 /100 | #83 | Exceptional 1.7% |
| Immigrants | Denmark | 99.2 /100 | #84 | Exceptional 1.7% |
| Immigrants | Australia | 99.2 /100 | #85 | Exceptional 1.7% |
| Ukrainians | 99.2 /100 | #86 | Exceptional 1.8% |
| Osage | 99.2 /100 | #87 | Exceptional 1.8% |
Demographics Similar to Immigrants from Taiwan by No Schooling Completed
In terms of no schooling completed, the demographic groups most similar to Immigrants from Taiwan are French American Indian (2.1%, a difference of 0.050%), Black/African American (2.1%, a difference of 0.15%), Pima (2.1%, a difference of 0.17%), Portuguese (2.1%, a difference of 0.18%), and Immigrants from Kazakhstan (2.1%, a difference of 0.24%).
| Demographics | Rating | Rank | No Schooling Completed |
| Immigrants | Micronesia | 50.0 /100 | #174 | Average 2.1% |
| Arabs | 46.4 /100 | #175 | Average 2.1% |
| Panamanians | 45.2 /100 | #176 | Average 2.1% |
| Arapaho | 45.0 /100 | #177 | Average 2.1% |
| Pakistanis | 44.7 /100 | #178 | Average 2.1% |
| Immigrants | Kazakhstan | 44.3 /100 | #179 | Average 2.1% |
| Portuguese | 43.9 /100 | #180 | Average 2.1% |
| Immigrants | Taiwan | 42.6 /100 | #181 | Average 2.1% |
| French American Indians | 42.2 /100 | #182 | Average 2.1% |
| Blacks/African Americans | 41.4 /100 | #183 | Average 2.1% |
| Pima | 41.3 /100 | #184 | Average 2.1% |
| Mongolians | 40.8 /100 | #185 | Average 2.1% |
| Immigrants | Bosnia and Herzegovina | 38.6 /100 | #186 | Fair 2.1% |
| Navajo | 36.5 /100 | #187 | Fair 2.1% |
| Immigrants | Kenya | 36.2 /100 | #188 | Fair 2.1% |