Cypriot vs Immigrants from Taiwan Self-Care Disability
COMPARE
Cypriot
Immigrants from Taiwan
Self-Care Disability
Self-Care Disability Comparison
Cypriots
Immigrants from Taiwan
2.2%
SELF-CARE DISABILITY
100.0/ 100
METRIC RATING
24th/ 347
METRIC RANK
2.2%
SELF-CARE DISABILITY
100.0/ 100
METRIC RATING
18th/ 347
METRIC RANK
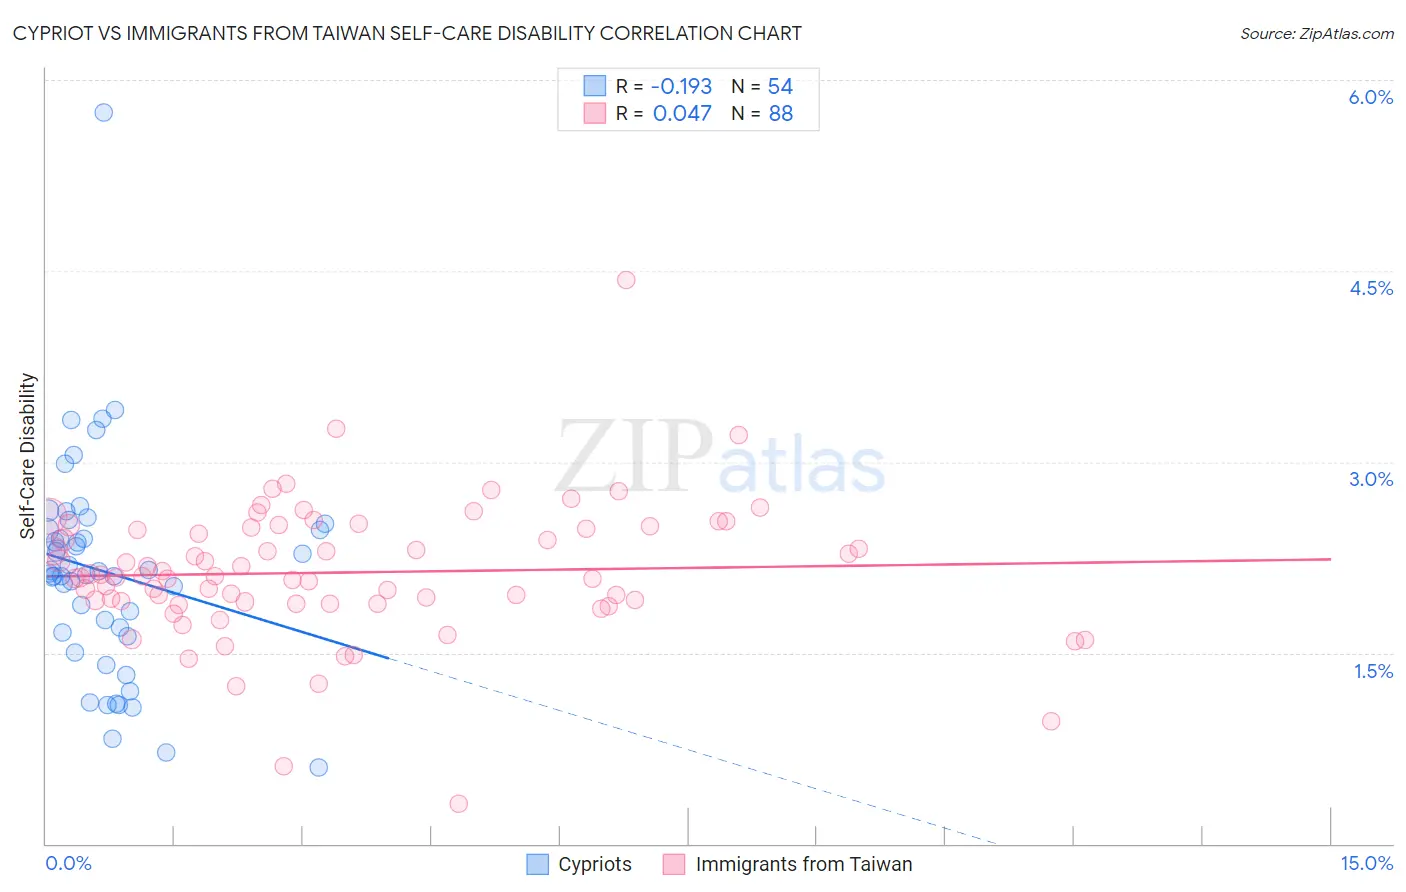
Cypriot vs Immigrants from Taiwan Self-Care Disability Correlation Chart
The statistical analysis conducted on geographies consisting of 61,833,470 people shows a poor negative correlation between the proportion of Cypriots and percentage of population with self-care disability in the United States with a correlation coefficient (R) of -0.193 and weighted average of 2.2%. Similarly, the statistical analysis conducted on geographies consisting of 297,966,372 people shows no correlation between the proportion of Immigrants from Taiwan and percentage of population with self-care disability in the United States with a correlation coefficient (R) of 0.047 and weighted average of 2.2%, a difference of 1.2%.
Self-Care Disability Correlation Summary
| Measurement | Cypriot | Immigrants from Taiwan |
| Minimum | 0.60% | 0.31% |
| Maximum | 5.7% | 4.4% |
| Range | 5.1% | 4.1% |
| Mean | 2.1% | 2.1% |
| Median | 2.1% | 2.1% |
| Interquartile 25% (IQ1) | 1.7% | 1.9% |
| Interquartile 75% (IQ3) | 2.5% | 2.5% |
| Interquartile Range (IQR) | 0.80% | 0.58% |
| Standard Deviation (Sample) | 0.84% | 0.54% |
| Standard Deviation (Population) | 0.83% | 0.54% |
Demographics Similar to Cypriots and Immigrants from Taiwan by Self-Care Disability
In terms of self-care disability, the demographic groups most similar to Cypriots are Turkish (2.2%, a difference of 0.11%), Immigrants from Sri Lanka (2.2%, a difference of 0.18%), Venezuelan (2.2%, a difference of 0.19%), Cambodian (2.2%, a difference of 0.30%), and Inupiat (2.2%, a difference of 0.35%). Similarly, the demographic groups most similar to Immigrants from Taiwan are Immigrants from Saudi Arabia (2.2%, a difference of 0.25%), Immigrants from Eritrea (2.2%, a difference of 0.33%), Tongan (2.2%, a difference of 0.41%), Immigrants from Kuwait (2.2%, a difference of 0.42%), and Bulgarian (2.2%, a difference of 0.66%).
| Demographics | Rating | Rank | Self-Care Disability |
| Immigrants | South Central Asia | 100.0 /100 | #11 | Exceptional 2.2% |
| Immigrants | Ethiopia | 100.0 /100 | #12 | Exceptional 2.2% |
| Ethiopians | 100.0 /100 | #13 | Exceptional 2.2% |
| Luxembourgers | 100.0 /100 | #14 | Exceptional 2.2% |
| Okinawans | 100.0 /100 | #15 | Exceptional 2.2% |
| Immigrants | Kuwait | 100.0 /100 | #16 | Exceptional 2.2% |
| Immigrants | Saudi Arabia | 100.0 /100 | #17 | Exceptional 2.2% |
| Immigrants | Taiwan | 100.0 /100 | #18 | Exceptional 2.2% |
| Immigrants | Eritrea | 100.0 /100 | #19 | Exceptional 2.2% |
| Tongans | 100.0 /100 | #20 | Exceptional 2.2% |
| Bulgarians | 100.0 /100 | #21 | Exceptional 2.2% |
| Immigrants | Venezuela | 100.0 /100 | #22 | Exceptional 2.2% |
| Cambodians | 100.0 /100 | #23 | Exceptional 2.2% |
| Cypriots | 100.0 /100 | #24 | Exceptional 2.2% |
| Turks | 100.0 /100 | #25 | Exceptional 2.2% |
| Immigrants | Sri Lanka | 99.9 /100 | #26 | Exceptional 2.2% |
| Venezuelans | 99.9 /100 | #27 | Exceptional 2.2% |
| Inupiat | 99.9 /100 | #28 | Exceptional 2.2% |
| Immigrants | Zimbabwe | 99.9 /100 | #29 | Exceptional 2.3% |
| Paraguayans | 99.9 /100 | #30 | Exceptional 2.3% |
| Danes | 99.9 /100 | #31 | Exceptional 2.3% |