Cypriot vs Sri Lankan No Schooling Completed
COMPARE
Cypriot
Sri Lankan
No Schooling Completed
No Schooling Completed Comparison
Cypriots
Sri Lankans
1.7%
NO SCHOOLING COMPLETED
99.3/ 100
METRIC RATING
80th/ 347
METRIC RANK
3.0%
NO SCHOOLING COMPLETED
0.0/ 100
METRIC RATING
312th/ 347
METRIC RANK
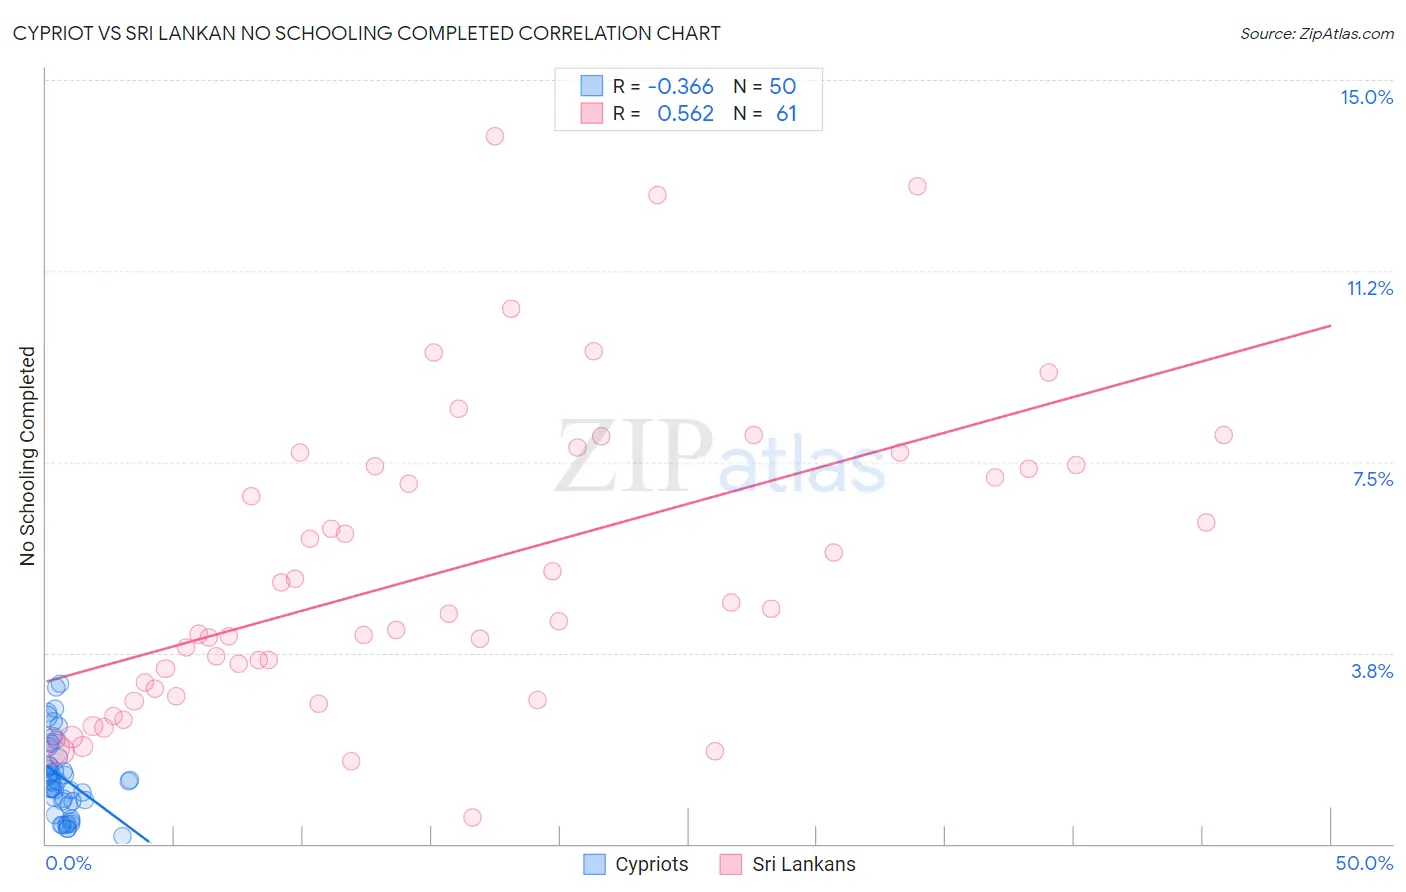
Cypriot vs Sri Lankan No Schooling Completed Correlation Chart
The statistical analysis conducted on geographies consisting of 61,760,973 people shows a mild negative correlation between the proportion of Cypriots and percentage of population with no schooling in the United States with a correlation coefficient (R) of -0.366 and weighted average of 1.7%. Similarly, the statistical analysis conducted on geographies consisting of 436,055,968 people shows a substantial positive correlation between the proportion of Sri Lankans and percentage of population with no schooling in the United States with a correlation coefficient (R) of 0.562 and weighted average of 3.0%, a difference of 74.8%.
No Schooling Completed Correlation Summary
| Measurement | Cypriot | Sri Lankan |
| Minimum | 0.14% | 0.51% |
| Maximum | 3.1% | 13.9% |
| Range | 3.0% | 13.4% |
| Mean | 1.3% | 5.4% |
| Median | 1.2% | 4.5% |
| Interquartile 25% (IQ1) | 0.84% | 3.0% |
| Interquartile 75% (IQ3) | 1.7% | 7.4% |
| Interquartile Range (IQR) | 0.85% | 4.5% |
| Standard Deviation (Sample) | 0.75% | 3.0% |
| Standard Deviation (Population) | 0.74% | 3.0% |
Similar Demographics by No Schooling Completed
Demographics Similar to Cypriots by No Schooling Completed
In terms of no schooling completed, the demographic groups most similar to Cypriots are Macedonian (1.7%, a difference of 0.010%), Icelander (1.7%, a difference of 0.040%), Delaware (1.7%, a difference of 0.090%), Immigrants from Sweden (1.7%, a difference of 0.13%), and Immigrants from South Africa (1.7%, a difference of 0.13%).
| Demographics | Rating | Rank | No Schooling Completed |
| Immigrants | India | 99.4 /100 | #73 | Exceptional 1.7% |
| Zimbabweans | 99.4 /100 | #74 | Exceptional 1.7% |
| Immigrants | Belgium | 99.3 /100 | #75 | Exceptional 1.7% |
| Cherokee | 99.3 /100 | #76 | Exceptional 1.7% |
| Immigrants | Sweden | 99.3 /100 | #77 | Exceptional 1.7% |
| Delaware | 99.3 /100 | #78 | Exceptional 1.7% |
| Macedonians | 99.3 /100 | #79 | Exceptional 1.7% |
| Cypriots | 99.3 /100 | #80 | Exceptional 1.7% |
| Icelanders | 99.3 /100 | #81 | Exceptional 1.7% |
| Immigrants | South Africa | 99.3 /100 | #82 | Exceptional 1.7% |
| Potawatomi | 99.3 /100 | #83 | Exceptional 1.7% |
| Immigrants | Denmark | 99.2 /100 | #84 | Exceptional 1.7% |
| Immigrants | Australia | 99.2 /100 | #85 | Exceptional 1.7% |
| Ukrainians | 99.2 /100 | #86 | Exceptional 1.8% |
| Osage | 99.2 /100 | #87 | Exceptional 1.8% |
Demographics Similar to Sri Lankans by No Schooling Completed
In terms of no schooling completed, the demographic groups most similar to Sri Lankans are Immigrants from the Azores (3.0%, a difference of 0.28%), Guyanese (3.0%, a difference of 0.38%), Hispanic or Latino (3.0%, a difference of 0.43%), Honduran (3.1%, a difference of 0.51%), and Immigrants from Belize (3.1%, a difference of 0.60%).
| Demographics | Rating | Rank | No Schooling Completed |
| Ecuadorians | 0.0 /100 | #305 | Tragic 3.0% |
| Belizeans | 0.0 /100 | #306 | Tragic 3.0% |
| Immigrants | Haiti | 0.0 /100 | #307 | Tragic 3.0% |
| Immigrants | Somalia | 0.0 /100 | #308 | Tragic 3.0% |
| Hispanics or Latinos | 0.0 /100 | #309 | Tragic 3.0% |
| Guyanese | 0.0 /100 | #310 | Tragic 3.0% |
| Immigrants | Azores | 0.0 /100 | #311 | Tragic 3.0% |
| Sri Lankans | 0.0 /100 | #312 | Tragic 3.0% |
| Hondurans | 0.0 /100 | #313 | Tragic 3.1% |
| Immigrants | Belize | 0.0 /100 | #314 | Tragic 3.1% |
| Immigrants | Nicaragua | 0.0 /100 | #315 | Tragic 3.1% |
| Immigrants | Ecuador | 0.0 /100 | #316 | Tragic 3.1% |
| Cape Verdeans | 0.0 /100 | #317 | Tragic 3.1% |
| Immigrants | Guyana | 0.0 /100 | #318 | Tragic 3.1% |
| Immigrants | Burma/Myanmar | 0.0 /100 | #319 | Tragic 3.1% |