Cypriot vs Immigrants from Taiwan Single Mother Households
COMPARE
Cypriot
Immigrants from Taiwan
Single Mother Households
Single Mother Households Comparison
Cypriots
Immigrants from Taiwan
5.1%
SINGLE MOTHER HOUSEHOLDS
99.9/ 100
METRIC RATING
12th/ 347
METRIC RANK
4.7%
SINGLE MOTHER HOUSEHOLDS
100.0/ 100
METRIC RATING
1st/ 347
METRIC RANK
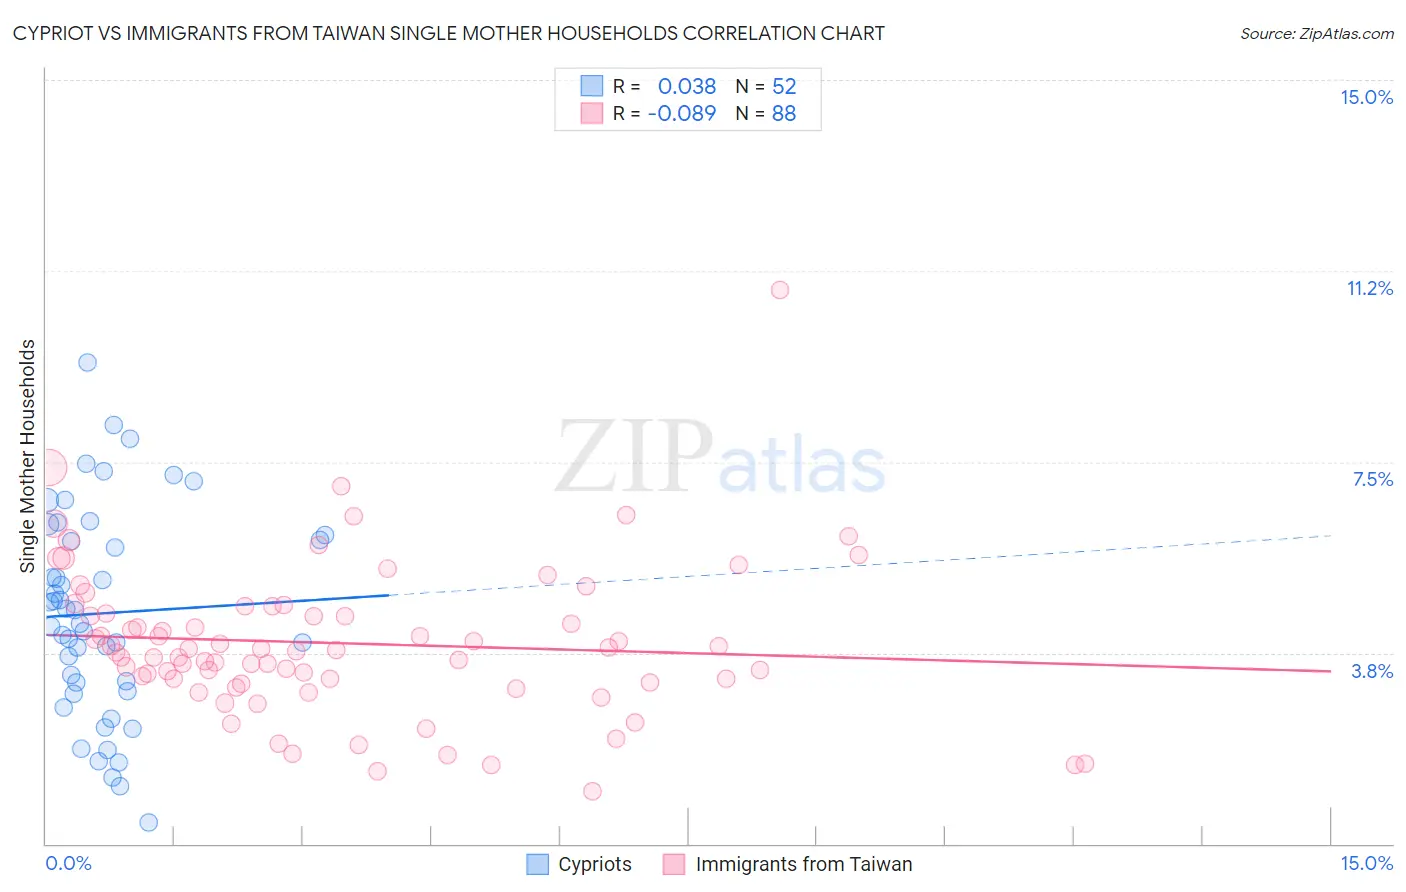
Cypriot vs Immigrants from Taiwan Single Mother Households Correlation Chart
The statistical analysis conducted on geographies consisting of 61,798,444 people shows no correlation between the proportion of Cypriots and percentage of single mother households in the United States with a correlation coefficient (R) of 0.038 and weighted average of 5.1%. Similarly, the statistical analysis conducted on geographies consisting of 297,635,593 people shows a slight negative correlation between the proportion of Immigrants from Taiwan and percentage of single mother households in the United States with a correlation coefficient (R) of -0.089 and weighted average of 4.7%, a difference of 8.3%.
Single Mother Households Correlation Summary
| Measurement | Cypriot | Immigrants from Taiwan |
| Minimum | 0.41% | 1.0% |
| Maximum | 9.5% | 10.9% |
| Range | 9.0% | 9.8% |
| Mean | 4.5% | 3.9% |
| Median | 4.5% | 3.8% |
| Interquartile 25% (IQ1) | 3.1% | 3.2% |
| Interquartile 75% (IQ3) | 6.0% | 4.6% |
| Interquartile Range (IQR) | 2.9% | 1.4% |
| Standard Deviation (Sample) | 2.0% | 1.5% |
| Standard Deviation (Population) | 2.0% | 1.5% |
Demographics Similar to Cypriots and Immigrants from Taiwan by Single Mother Households
In terms of single mother households, the demographic groups most similar to Cypriots are Immigrants from India (5.1%, a difference of 0.12%), Immigrants from China (5.1%, a difference of 0.18%), Immigrants from Australia (5.1%, a difference of 0.45%), Immigrants from Eastern Asia (5.1%, a difference of 0.54%), and Indian (Asian) (5.1%, a difference of 0.73%). Similarly, the demographic groups most similar to Immigrants from Taiwan are Filipino (4.7%, a difference of 0.30%), Immigrants from Iran (4.8%, a difference of 2.6%), Assyrian/Chaldean/Syriac (4.8%, a difference of 2.7%), Immigrants from Hong Kong (4.8%, a difference of 3.3%), and Immigrants from Singapore (5.0%, a difference of 5.9%).
| Demographics | Rating | Rank | Single Mother Households |
| Immigrants | Taiwan | 100.0 /100 | #1 | Exceptional 4.7% |
| Filipinos | 100.0 /100 | #2 | Exceptional 4.7% |
| Immigrants | Iran | 100.0 /100 | #3 | Exceptional 4.8% |
| Assyrians/Chaldeans/Syriacs | 100.0 /100 | #4 | Exceptional 4.8% |
| Immigrants | Hong Kong | 100.0 /100 | #5 | Exceptional 4.8% |
| Immigrants | Singapore | 100.0 /100 | #6 | Exceptional 5.0% |
| Iranians | 100.0 /100 | #7 | Exceptional 5.0% |
| Immigrants | Ireland | 99.9 /100 | #8 | Exceptional 5.0% |
| Okinawans | 99.9 /100 | #9 | Exceptional 5.0% |
| Immigrants | Israel | 99.9 /100 | #10 | Exceptional 5.0% |
| Immigrants | China | 99.9 /100 | #11 | Exceptional 5.1% |
| Cypriots | 99.9 /100 | #12 | Exceptional 5.1% |
| Immigrants | India | 99.9 /100 | #13 | Exceptional 5.1% |
| Immigrants | Australia | 99.9 /100 | #14 | Exceptional 5.1% |
| Immigrants | Eastern Asia | 99.9 /100 | #15 | Exceptional 5.1% |
| Indians (Asian) | 99.9 /100 | #16 | Exceptional 5.1% |
| Soviet Union | 99.9 /100 | #17 | Exceptional 5.1% |
| Immigrants | Armenia | 99.9 /100 | #18 | Exceptional 5.2% |
| Chinese | 99.9 /100 | #19 | Exceptional 5.2% |
| Maltese | 99.9 /100 | #20 | Exceptional 5.2% |