Cypriot vs Blackfeet No Schooling Completed
COMPARE
Cypriot
Blackfeet
No Schooling Completed
No Schooling Completed Comparison
Cypriots
Blackfeet
1.7%
NO SCHOOLING COMPLETED
99.3/ 100
METRIC RATING
80th/ 347
METRIC RANK
2.0%
NO SCHOOLING COMPLETED
72.9/ 100
METRIC RATING
150th/ 347
METRIC RANK
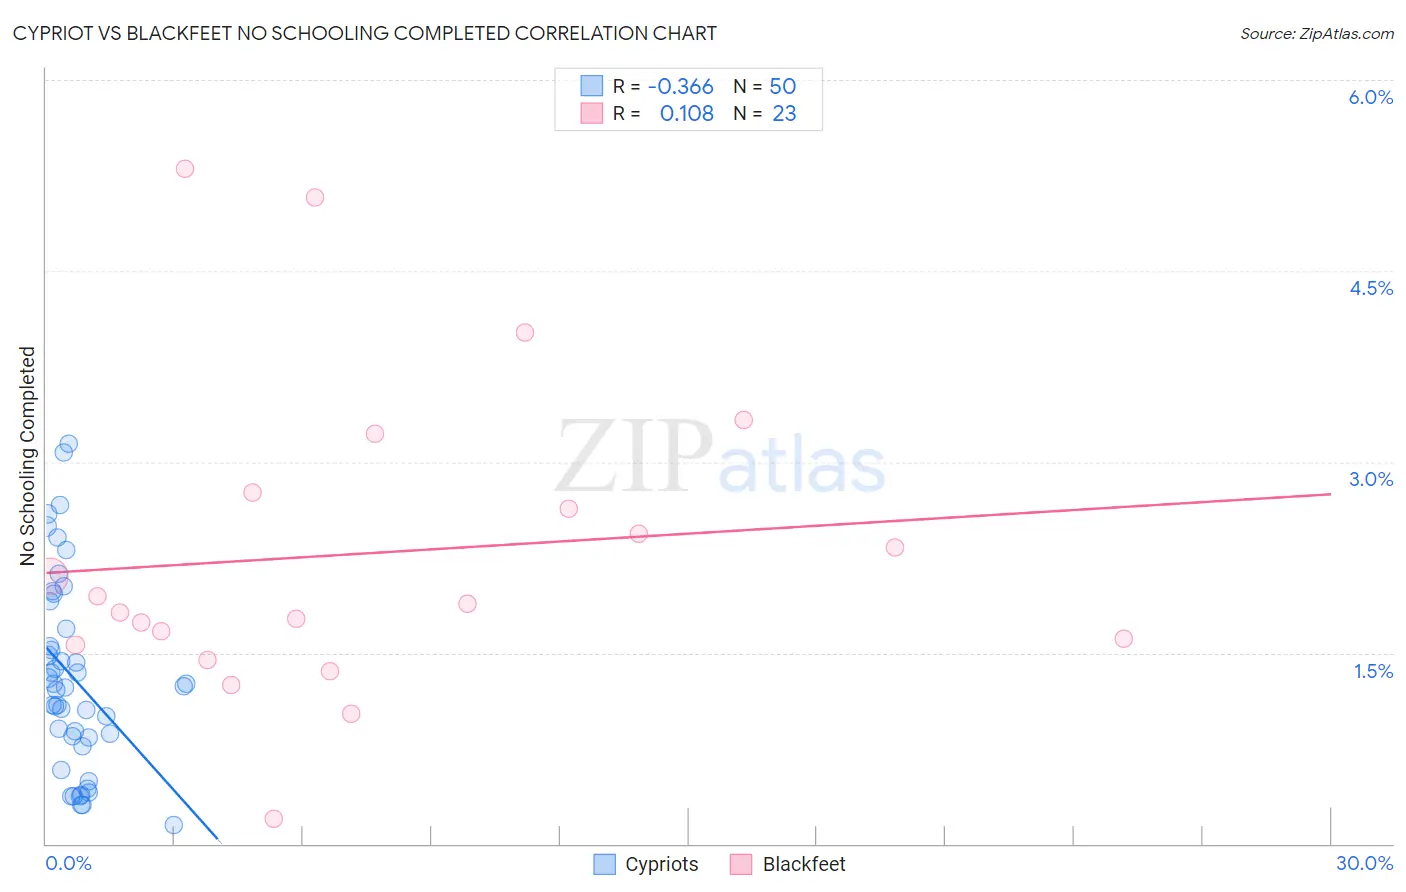
Cypriot vs Blackfeet No Schooling Completed Correlation Chart
The statistical analysis conducted on geographies consisting of 61,760,973 people shows a mild negative correlation between the proportion of Cypriots and percentage of population with no schooling in the United States with a correlation coefficient (R) of -0.366 and weighted average of 1.7%. Similarly, the statistical analysis conducted on geographies consisting of 307,289,730 people shows a poor positive correlation between the proportion of Blackfeet and percentage of population with no schooling in the United States with a correlation coefficient (R) of 0.108 and weighted average of 2.0%, a difference of 15.9%.
No Schooling Completed Correlation Summary
| Measurement | Cypriot | Blackfeet |
| Minimum | 0.14% | 0.20% |
| Maximum | 3.1% | 5.3% |
| Range | 3.0% | 5.1% |
| Mean | 1.3% | 2.3% |
| Median | 1.2% | 1.9% |
| Interquartile 25% (IQ1) | 0.84% | 1.6% |
| Interquartile 75% (IQ3) | 1.7% | 2.8% |
| Interquartile Range (IQR) | 0.85% | 1.2% |
| Standard Deviation (Sample) | 0.75% | 1.2% |
| Standard Deviation (Population) | 0.74% | 1.2% |
Similar Demographics by No Schooling Completed
Demographics Similar to Cypriots by No Schooling Completed
In terms of no schooling completed, the demographic groups most similar to Cypriots are Macedonian (1.7%, a difference of 0.010%), Icelander (1.7%, a difference of 0.040%), Delaware (1.7%, a difference of 0.090%), Immigrants from Sweden (1.7%, a difference of 0.13%), and Immigrants from South Africa (1.7%, a difference of 0.13%).
| Demographics | Rating | Rank | No Schooling Completed |
| Immigrants | India | 99.4 /100 | #73 | Exceptional 1.7% |
| Zimbabweans | 99.4 /100 | #74 | Exceptional 1.7% |
| Immigrants | Belgium | 99.3 /100 | #75 | Exceptional 1.7% |
| Cherokee | 99.3 /100 | #76 | Exceptional 1.7% |
| Immigrants | Sweden | 99.3 /100 | #77 | Exceptional 1.7% |
| Delaware | 99.3 /100 | #78 | Exceptional 1.7% |
| Macedonians | 99.3 /100 | #79 | Exceptional 1.7% |
| Cypriots | 99.3 /100 | #80 | Exceptional 1.7% |
| Icelanders | 99.3 /100 | #81 | Exceptional 1.7% |
| Immigrants | South Africa | 99.3 /100 | #82 | Exceptional 1.7% |
| Potawatomi | 99.3 /100 | #83 | Exceptional 1.7% |
| Immigrants | Denmark | 99.2 /100 | #84 | Exceptional 1.7% |
| Immigrants | Australia | 99.2 /100 | #85 | Exceptional 1.7% |
| Ukrainians | 99.2 /100 | #86 | Exceptional 1.8% |
| Osage | 99.2 /100 | #87 | Exceptional 1.8% |
Demographics Similar to Blackfeet by No Schooling Completed
In terms of no schooling completed, the demographic groups most similar to Blackfeet are Immigrants from Jordan (2.0%, a difference of 0.34%), Immigrants from Eastern Europe (2.0%, a difference of 0.43%), Immigrants from North Macedonia (2.0%, a difference of 0.56%), Immigrants from Italy (2.0%, a difference of 0.67%), and Shoshone (2.0%, a difference of 0.71%).
| Demographics | Rating | Rank | No Schooling Completed |
| Immigrants | South Central Asia | 80.0 /100 | #143 | Good 2.0% |
| Alsatians | 79.1 /100 | #144 | Good 2.0% |
| Immigrants | Iran | 79.0 /100 | #145 | Good 2.0% |
| Immigrants | Moldova | 78.0 /100 | #146 | Good 2.0% |
| Soviet Union | 77.1 /100 | #147 | Good 2.0% |
| Shoshone | 76.7 /100 | #148 | Good 2.0% |
| Immigrants | North Macedonia | 75.9 /100 | #149 | Good 2.0% |
| Blackfeet | 72.9 /100 | #150 | Good 2.0% |
| Immigrants | Jordan | 70.9 /100 | #151 | Good 2.0% |
| Immigrants | Eastern Europe | 70.4 /100 | #152 | Good 2.0% |
| Immigrants | Italy | 68.9 /100 | #153 | Good 2.0% |
| Immigrants | Venezuela | 68.5 /100 | #154 | Good 2.0% |
| Immigrants | Russia | 67.6 /100 | #155 | Good 2.0% |
| Chileans | 67.2 /100 | #156 | Good 2.0% |
| Immigrants | Sri Lanka | 67.0 /100 | #157 | Good 2.0% |