Cypriot vs Navajo No Schooling Completed
COMPARE
Cypriot
Navajo
No Schooling Completed
No Schooling Completed Comparison
Cypriots
Navajo
1.7%
NO SCHOOLING COMPLETED
99.3/ 100
METRIC RATING
80th/ 347
METRIC RANK
2.1%
NO SCHOOLING COMPLETED
36.5/ 100
METRIC RATING
187th/ 347
METRIC RANK
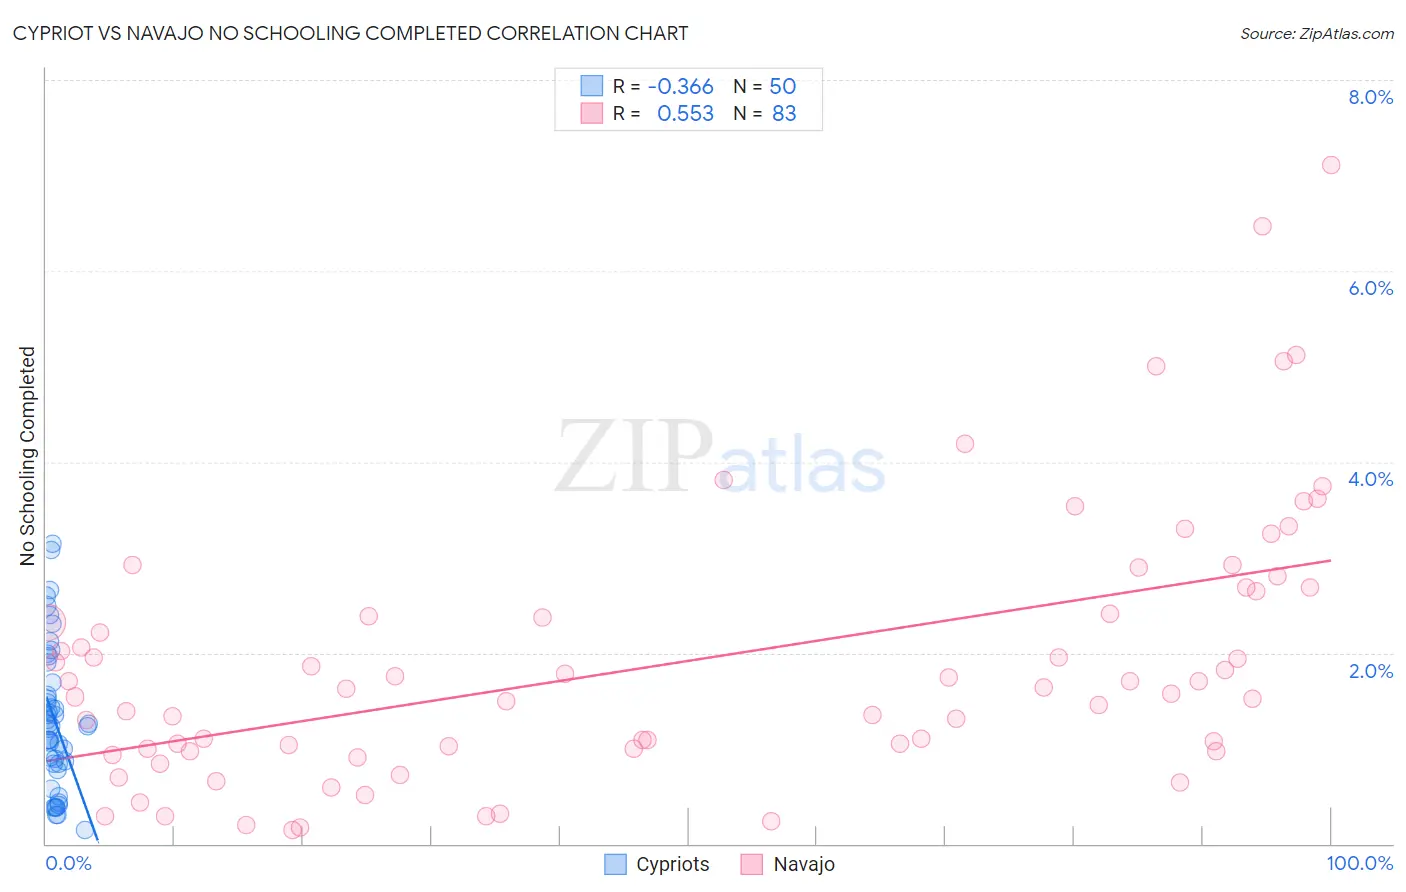
Cypriot vs Navajo No Schooling Completed Correlation Chart
The statistical analysis conducted on geographies consisting of 61,760,973 people shows a mild negative correlation between the proportion of Cypriots and percentage of population with no schooling in the United States with a correlation coefficient (R) of -0.366 and weighted average of 1.7%. Similarly, the statistical analysis conducted on geographies consisting of 223,187,945 people shows a substantial positive correlation between the proportion of Navajo and percentage of population with no schooling in the United States with a correlation coefficient (R) of 0.553 and weighted average of 2.1%, a difference of 22.1%.
No Schooling Completed Correlation Summary
| Measurement | Cypriot | Navajo |
| Minimum | 0.14% | 0.14% |
| Maximum | 3.1% | 7.1% |
| Range | 3.0% | 7.0% |
| Mean | 1.3% | 1.9% |
| Median | 1.2% | 1.6% |
| Interquartile 25% (IQ1) | 0.84% | 0.99% |
| Interquartile 75% (IQ3) | 1.7% | 2.6% |
| Interquartile Range (IQR) | 0.85% | 1.7% |
| Standard Deviation (Sample) | 0.75% | 1.4% |
| Standard Deviation (Population) | 0.74% | 1.4% |
Similar Demographics by No Schooling Completed
Demographics Similar to Cypriots by No Schooling Completed
In terms of no schooling completed, the demographic groups most similar to Cypriots are Macedonian (1.7%, a difference of 0.010%), Icelander (1.7%, a difference of 0.040%), Delaware (1.7%, a difference of 0.090%), Immigrants from Sweden (1.7%, a difference of 0.13%), and Immigrants from South Africa (1.7%, a difference of 0.13%).
| Demographics | Rating | Rank | No Schooling Completed |
| Immigrants | India | 99.4 /100 | #73 | Exceptional 1.7% |
| Zimbabweans | 99.4 /100 | #74 | Exceptional 1.7% |
| Immigrants | Belgium | 99.3 /100 | #75 | Exceptional 1.7% |
| Cherokee | 99.3 /100 | #76 | Exceptional 1.7% |
| Immigrants | Sweden | 99.3 /100 | #77 | Exceptional 1.7% |
| Delaware | 99.3 /100 | #78 | Exceptional 1.7% |
| Macedonians | 99.3 /100 | #79 | Exceptional 1.7% |
| Cypriots | 99.3 /100 | #80 | Exceptional 1.7% |
| Icelanders | 99.3 /100 | #81 | Exceptional 1.7% |
| Immigrants | South Africa | 99.3 /100 | #82 | Exceptional 1.7% |
| Potawatomi | 99.3 /100 | #83 | Exceptional 1.7% |
| Immigrants | Denmark | 99.2 /100 | #84 | Exceptional 1.7% |
| Immigrants | Australia | 99.2 /100 | #85 | Exceptional 1.7% |
| Ukrainians | 99.2 /100 | #86 | Exceptional 1.8% |
| Osage | 99.2 /100 | #87 | Exceptional 1.8% |
Demographics Similar to Navajo by No Schooling Completed
In terms of no schooling completed, the demographic groups most similar to Navajo are Immigrants from Kenya (2.1%, a difference of 0.050%), Immigrants from Egypt (2.1%, a difference of 0.060%), Immigrants from Bosnia and Herzegovina (2.1%, a difference of 0.30%), Spanish American (2.1%, a difference of 0.57%), and Mongolian (2.1%, a difference of 0.60%).
| Demographics | Rating | Rank | No Schooling Completed |
| Portuguese | 43.9 /100 | #180 | Average 2.1% |
| Immigrants | Taiwan | 42.6 /100 | #181 | Average 2.1% |
| French American Indians | 42.2 /100 | #182 | Average 2.1% |
| Blacks/African Americans | 41.4 /100 | #183 | Average 2.1% |
| Pima | 41.3 /100 | #184 | Average 2.1% |
| Mongolians | 40.8 /100 | #185 | Average 2.1% |
| Immigrants | Bosnia and Herzegovina | 38.6 /100 | #186 | Fair 2.1% |
| Navajo | 36.5 /100 | #187 | Fair 2.1% |
| Immigrants | Kenya | 36.2 /100 | #188 | Fair 2.1% |
| Immigrants | Egypt | 36.1 /100 | #189 | Fair 2.1% |
| Spanish Americans | 32.6 /100 | #190 | Fair 2.1% |
| Bermudans | 30.7 /100 | #191 | Fair 2.1% |
| Guamanians/Chamorros | 29.8 /100 | #192 | Fair 2.2% |
| Paraguayans | 29.3 /100 | #193 | Fair 2.2% |
| Immigrants | Albania | 28.3 /100 | #194 | Fair 2.2% |