Cypriot vs Immigrants from Cameroon No Schooling Completed
COMPARE
Cypriot
Immigrants from Cameroon
No Schooling Completed
No Schooling Completed Comparison
Cypriots
Immigrants from Cameroon
1.7%
NO SCHOOLING COMPLETED
99.3/ 100
METRIC RATING
80th/ 347
METRIC RANK
2.5%
NO SCHOOLING COMPLETED
0.1/ 100
METRIC RATING
273rd/ 347
METRIC RANK
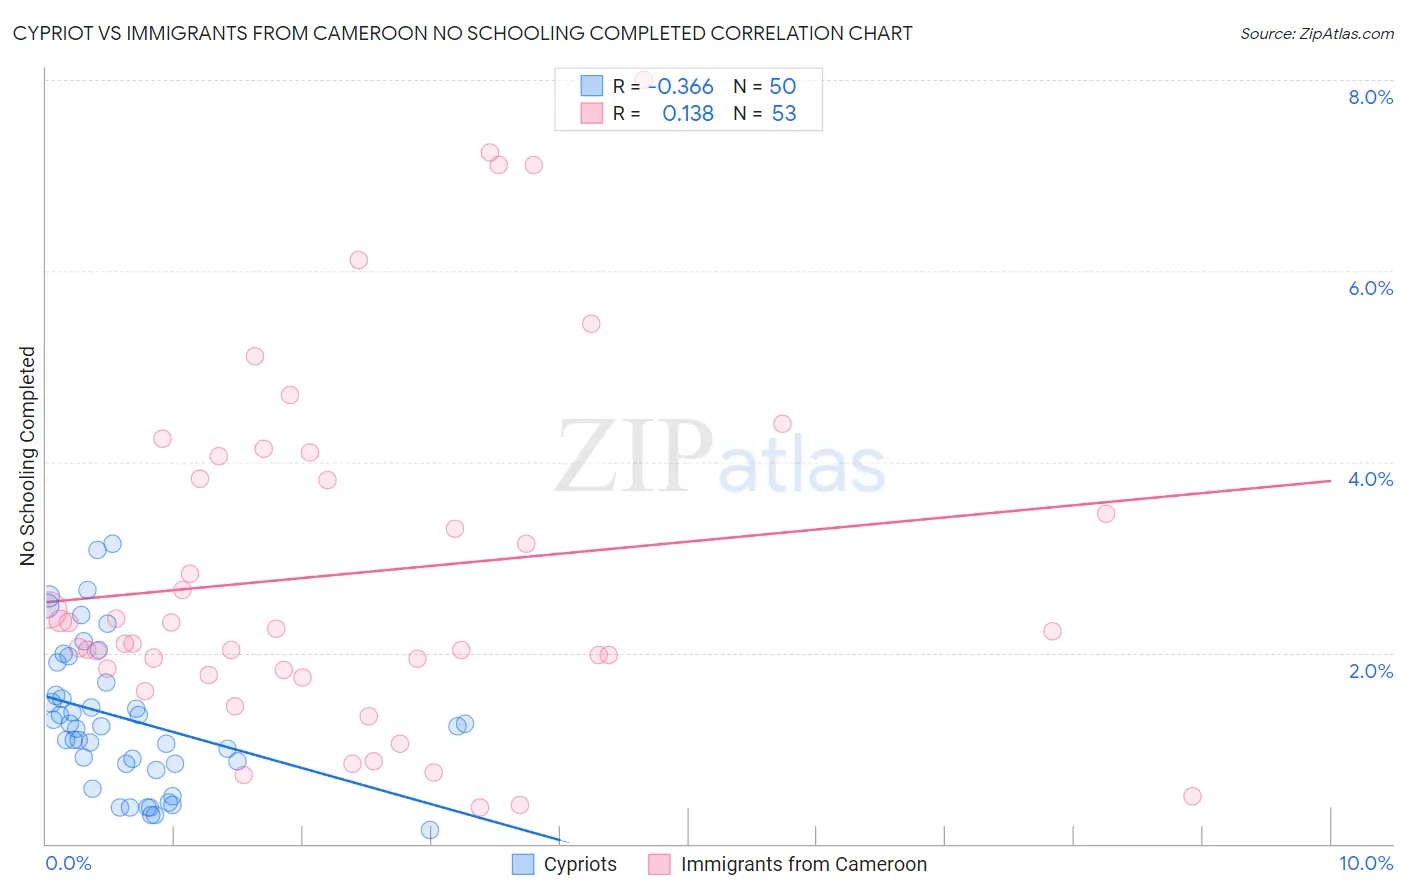
Cypriot vs Immigrants from Cameroon No Schooling Completed Correlation Chart
The statistical analysis conducted on geographies consisting of 61,760,973 people shows a mild negative correlation between the proportion of Cypriots and percentage of population with no schooling in the United States with a correlation coefficient (R) of -0.366 and weighted average of 1.7%. Similarly, the statistical analysis conducted on geographies consisting of 130,544,113 people shows a poor positive correlation between the proportion of Immigrants from Cameroon and percentage of population with no schooling in the United States with a correlation coefficient (R) of 0.138 and weighted average of 2.5%, a difference of 46.1%.
No Schooling Completed Correlation Summary
| Measurement | Cypriot | Immigrants from Cameroon |
| Minimum | 0.14% | 0.38% |
| Maximum | 3.1% | 8.0% |
| Range | 3.0% | 7.6% |
| Mean | 1.3% | 2.8% |
| Median | 1.2% | 2.2% |
| Interquartile 25% (IQ1) | 0.84% | 1.8% |
| Interquartile 75% (IQ3) | 1.7% | 3.9% |
| Interquartile Range (IQR) | 0.85% | 2.1% |
| Standard Deviation (Sample) | 0.75% | 1.8% |
| Standard Deviation (Population) | 0.74% | 1.8% |
Similar Demographics by No Schooling Completed
Demographics Similar to Cypriots by No Schooling Completed
In terms of no schooling completed, the demographic groups most similar to Cypriots are Macedonian (1.7%, a difference of 0.010%), Icelander (1.7%, a difference of 0.040%), Delaware (1.7%, a difference of 0.090%), Immigrants from Sweden (1.7%, a difference of 0.13%), and Immigrants from South Africa (1.7%, a difference of 0.13%).
| Demographics | Rating | Rank | No Schooling Completed |
| Immigrants | India | 99.4 /100 | #73 | Exceptional 1.7% |
| Zimbabweans | 99.4 /100 | #74 | Exceptional 1.7% |
| Immigrants | Belgium | 99.3 /100 | #75 | Exceptional 1.7% |
| Cherokee | 99.3 /100 | #76 | Exceptional 1.7% |
| Immigrants | Sweden | 99.3 /100 | #77 | Exceptional 1.7% |
| Delaware | 99.3 /100 | #78 | Exceptional 1.7% |
| Macedonians | 99.3 /100 | #79 | Exceptional 1.7% |
| Cypriots | 99.3 /100 | #80 | Exceptional 1.7% |
| Icelanders | 99.3 /100 | #81 | Exceptional 1.7% |
| Immigrants | South Africa | 99.3 /100 | #82 | Exceptional 1.7% |
| Potawatomi | 99.3 /100 | #83 | Exceptional 1.7% |
| Immigrants | Denmark | 99.2 /100 | #84 | Exceptional 1.7% |
| Immigrants | Australia | 99.2 /100 | #85 | Exceptional 1.7% |
| Ukrainians | 99.2 /100 | #86 | Exceptional 1.8% |
| Osage | 99.2 /100 | #87 | Exceptional 1.8% |
Demographics Similar to Immigrants from Cameroon by No Schooling Completed
In terms of no schooling completed, the demographic groups most similar to Immigrants from Cameroon are Ghanaian (2.6%, a difference of 0.37%), Immigrants from China (2.6%, a difference of 0.56%), Immigrants from Bolivia (2.5%, a difference of 0.79%), Immigrants from Western Africa (2.6%, a difference of 1.1%), and Immigrants from Philippines (2.6%, a difference of 1.2%).
| Demographics | Rating | Rank | No Schooling Completed |
| Fijians | 0.4 /100 | #266 | Tragic 2.5% |
| Yuman | 0.4 /100 | #267 | Tragic 2.5% |
| Taiwanese | 0.3 /100 | #268 | Tragic 2.5% |
| Immigrants | Nigeria | 0.2 /100 | #269 | Tragic 2.5% |
| Immigrants | Peru | 0.2 /100 | #270 | Tragic 2.5% |
| Cubans | 0.2 /100 | #271 | Tragic 2.5% |
| Immigrants | Bolivia | 0.2 /100 | #272 | Tragic 2.5% |
| Immigrants | Cameroon | 0.1 /100 | #273 | Tragic 2.5% |
| Ghanaians | 0.1 /100 | #274 | Tragic 2.6% |
| Immigrants | China | 0.1 /100 | #275 | Tragic 2.6% |
| Immigrants | Western Africa | 0.1 /100 | #276 | Tragic 2.6% |
| Immigrants | Philippines | 0.1 /100 | #277 | Tragic 2.6% |
| Immigrants | Uzbekistan | 0.1 /100 | #278 | Tragic 2.6% |
| Barbadians | 0.1 /100 | #279 | Tragic 2.6% |
| Trinidadians and Tobagonians | 0.1 /100 | #280 | Tragic 2.6% |