Cypriot vs Immigrants from Uruguay No Schooling Completed
COMPARE
Cypriot
Immigrants from Uruguay
No Schooling Completed
No Schooling Completed Comparison
Cypriots
Immigrants from Uruguay
1.7%
NO SCHOOLING COMPLETED
99.3/ 100
METRIC RATING
80th/ 347
METRIC RANK
2.3%
NO SCHOOLING COMPLETED
3.4/ 100
METRIC RATING
231st/ 347
METRIC RANK
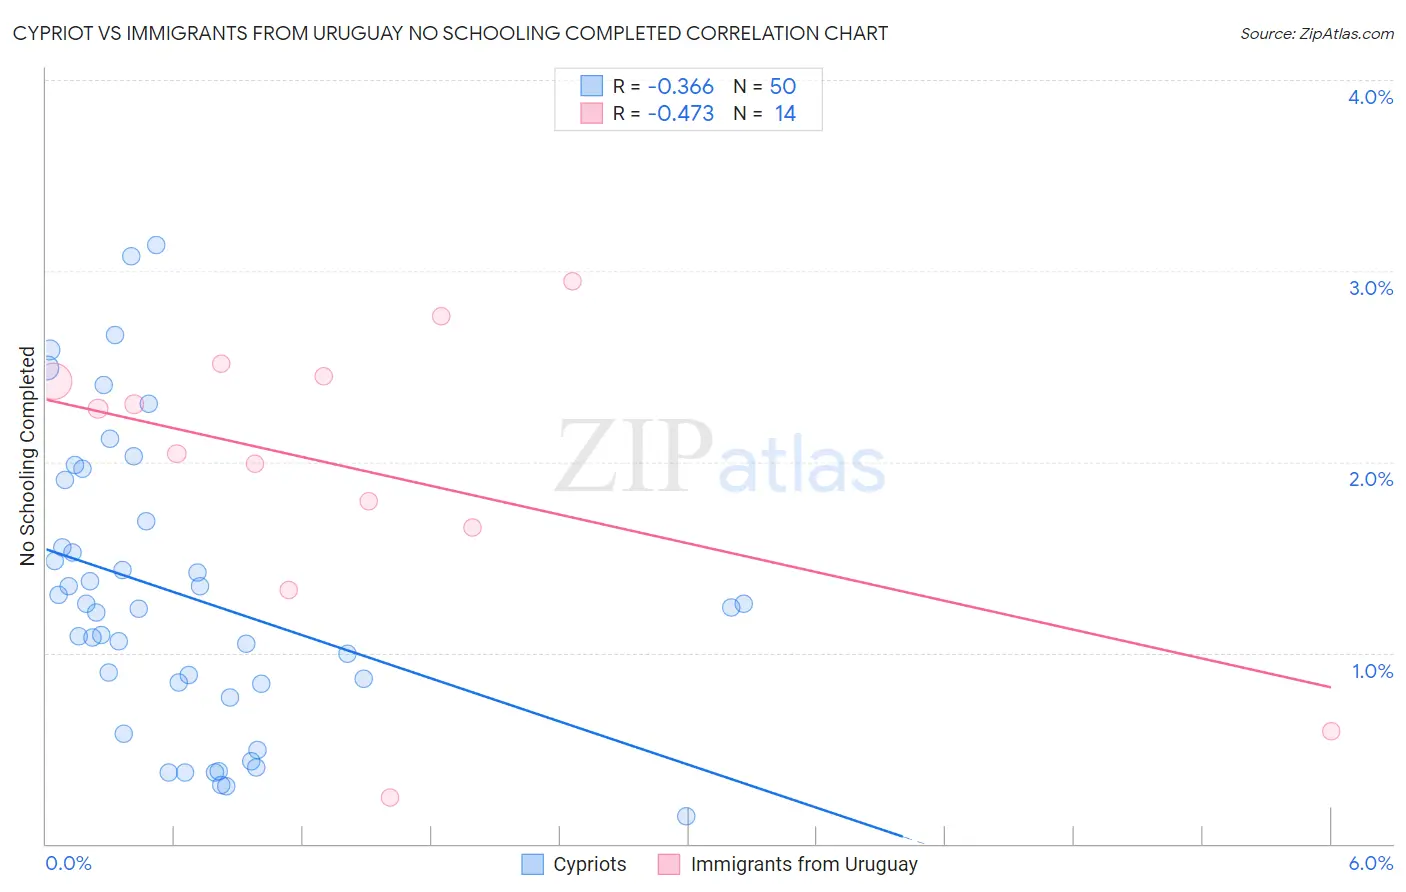
Cypriot vs Immigrants from Uruguay No Schooling Completed Correlation Chart
The statistical analysis conducted on geographies consisting of 61,760,973 people shows a mild negative correlation between the proportion of Cypriots and percentage of population with no schooling in the United States with a correlation coefficient (R) of -0.366 and weighted average of 1.7%. Similarly, the statistical analysis conducted on geographies consisting of 132,928,129 people shows a moderate negative correlation between the proportion of Immigrants from Uruguay and percentage of population with no schooling in the United States with a correlation coefficient (R) of -0.473 and weighted average of 2.3%, a difference of 33.4%.
No Schooling Completed Correlation Summary
| Measurement | Cypriot | Immigrants from Uruguay |
| Minimum | 0.14% | 0.24% |
| Maximum | 3.1% | 2.9% |
| Range | 3.0% | 2.7% |
| Mean | 1.3% | 2.0% |
| Median | 1.2% | 2.2% |
| Interquartile 25% (IQ1) | 0.84% | 1.7% |
| Interquartile 75% (IQ3) | 1.7% | 2.5% |
| Interquartile Range (IQR) | 0.85% | 0.80% |
| Standard Deviation (Sample) | 0.75% | 0.78% |
| Standard Deviation (Population) | 0.74% | 0.75% |
Similar Demographics by No Schooling Completed
Demographics Similar to Cypriots by No Schooling Completed
In terms of no schooling completed, the demographic groups most similar to Cypriots are Macedonian (1.7%, a difference of 0.010%), Icelander (1.7%, a difference of 0.040%), Delaware (1.7%, a difference of 0.090%), Immigrants from Sweden (1.7%, a difference of 0.13%), and Immigrants from South Africa (1.7%, a difference of 0.13%).
| Demographics | Rating | Rank | No Schooling Completed |
| Immigrants | India | 99.4 /100 | #73 | Exceptional 1.7% |
| Zimbabweans | 99.4 /100 | #74 | Exceptional 1.7% |
| Immigrants | Belgium | 99.3 /100 | #75 | Exceptional 1.7% |
| Cherokee | 99.3 /100 | #76 | Exceptional 1.7% |
| Immigrants | Sweden | 99.3 /100 | #77 | Exceptional 1.7% |
| Delaware | 99.3 /100 | #78 | Exceptional 1.7% |
| Macedonians | 99.3 /100 | #79 | Exceptional 1.7% |
| Cypriots | 99.3 /100 | #80 | Exceptional 1.7% |
| Icelanders | 99.3 /100 | #81 | Exceptional 1.7% |
| Immigrants | South Africa | 99.3 /100 | #82 | Exceptional 1.7% |
| Potawatomi | 99.3 /100 | #83 | Exceptional 1.7% |
| Immigrants | Denmark | 99.2 /100 | #84 | Exceptional 1.7% |
| Immigrants | Australia | 99.2 /100 | #85 | Exceptional 1.7% |
| Ukrainians | 99.2 /100 | #86 | Exceptional 1.8% |
| Osage | 99.2 /100 | #87 | Exceptional 1.8% |
Demographics Similar to Immigrants from Uruguay by No Schooling Completed
In terms of no schooling completed, the demographic groups most similar to Immigrants from Uruguay are Puerto Rican (2.3%, a difference of 0.020%), Immigrants from Pakistan (2.3%, a difference of 0.16%), Colombian (2.3%, a difference of 0.22%), U.S. Virgin Islander (2.3%, a difference of 0.24%), and Immigrants from Uganda (2.3%, a difference of 0.53%).
| Demographics | Rating | Rank | No Schooling Completed |
| Tohono O'odham | 4.1 /100 | #224 | Tragic 2.3% |
| Sudanese | 4.1 /100 | #225 | Tragic 2.3% |
| Sierra Leoneans | 4.1 /100 | #226 | Tragic 2.3% |
| Immigrants | Uganda | 4.0 /100 | #227 | Tragic 2.3% |
| U.S. Virgin Islanders | 3.7 /100 | #228 | Tragic 2.3% |
| Immigrants | Pakistan | 3.6 /100 | #229 | Tragic 2.3% |
| Puerto Ricans | 3.4 /100 | #230 | Tragic 2.3% |
| Immigrants | Uruguay | 3.4 /100 | #231 | Tragic 2.3% |
| Colombians | 3.2 /100 | #232 | Tragic 2.3% |
| Immigrants | Malaysia | 2.8 /100 | #233 | Tragic 2.3% |
| Nigerians | 2.6 /100 | #234 | Tragic 2.3% |
| Immigrants | Western Asia | 2.6 /100 | #235 | Tragic 2.3% |
| Iraqis | 2.2 /100 | #236 | Tragic 2.4% |
| Immigrants | Eastern Asia | 2.0 /100 | #237 | Tragic 2.4% |
| Paiute | 1.9 /100 | #238 | Tragic 2.4% |