Cypriot vs Immigrants from Taiwan Per Capita Income
COMPARE
Cypriot
Immigrants from Taiwan
Per Capita Income
Per Capita Income Comparison
Cypriots
Immigrants from Taiwan
$54,899
PER CAPITA INCOME
100.0/ 100
METRIC RATING
15th/ 347
METRIC RANK
$57,742
PER CAPITA INCOME
100.0/ 100
METRIC RATING
6th/ 347
METRIC RANK
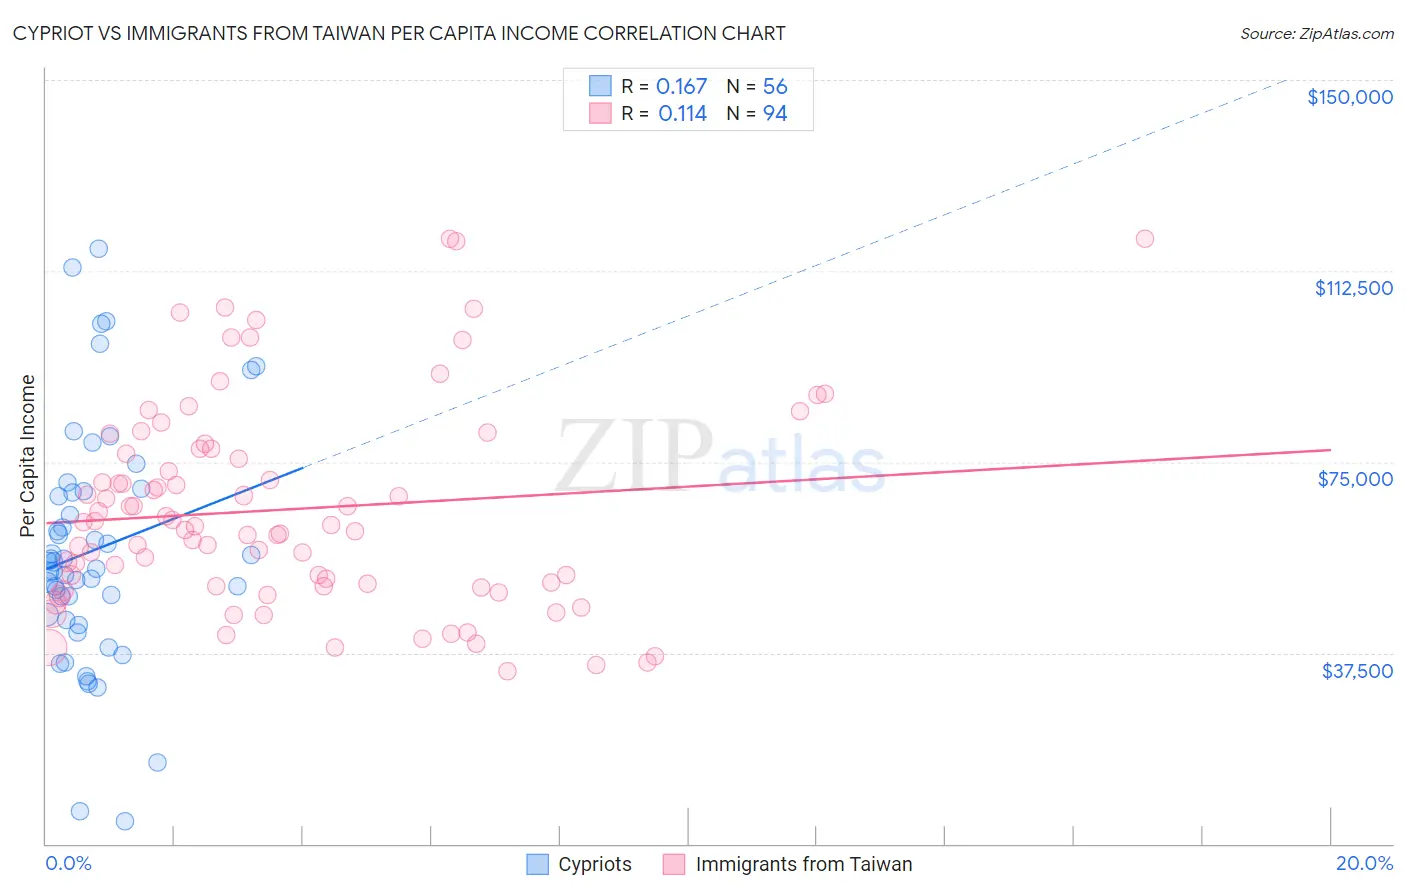
Cypriot vs Immigrants from Taiwan Per Capita Income Correlation Chart
The statistical analysis conducted on geographies consisting of 61,866,365 people shows a poor positive correlation between the proportion of Cypriots and per capita income in the United States with a correlation coefficient (R) of 0.167 and weighted average of $54,899. Similarly, the statistical analysis conducted on geographies consisting of 298,270,368 people shows a poor positive correlation between the proportion of Immigrants from Taiwan and per capita income in the United States with a correlation coefficient (R) of 0.114 and weighted average of $57,742, a difference of 5.2%.
Per Capita Income Correlation Summary
| Measurement | Cypriot | Immigrants from Taiwan |
| Minimum | $4,509 | $33,786 |
| Maximum | $116,766 | $118,914 |
| Range | $112,257 | $85,128 |
| Mean | $57,593 | $65,673 |
| Median | $54,638 | $62,475 |
| Interquartile 25% (IQ1) | $44,518 | $50,616 |
| Interquartile 75% (IQ3) | $69,117 | $77,568 |
| Interquartile Range (IQR) | $24,599 | $26,952 |
| Standard Deviation (Sample) | $23,513 | $20,163 |
| Standard Deviation (Population) | $23,302 | $20,056 |
Demographics Similar to Cypriots and Immigrants from Taiwan by Per Capita Income
In terms of per capita income, the demographic groups most similar to Cypriots are Immigrants from Switzerland ($54,866, a difference of 0.060%), Immigrants from Belgium ($55,082, a difference of 0.33%), Immigrants from France ($54,557, a difference of 0.63%), Immigrants from India ($55,268, a difference of 0.67%), and Thai ($54,307, a difference of 1.1%). Similarly, the demographic groups most similar to Immigrants from Taiwan are Immigrants from Iran ($57,759, a difference of 0.030%), Immigrants from Australia ($57,953, a difference of 0.37%), Immigrants from Israel ($57,384, a difference of 0.62%), Immigrants from Singapore ($58,353, a difference of 1.1%), and Iranian ($58,786, a difference of 1.8%).
| Demographics | Rating | Rank | Per Capita Income |
| Filipinos | 100.0 /100 | #1 | Exceptional $59,066 |
| Iranians | 100.0 /100 | #2 | Exceptional $58,786 |
| Immigrants | Singapore | 100.0 /100 | #3 | Exceptional $58,353 |
| Immigrants | Australia | 100.0 /100 | #4 | Exceptional $57,953 |
| Immigrants | Iran | 100.0 /100 | #5 | Exceptional $57,759 |
| Immigrants | Taiwan | 100.0 /100 | #6 | Exceptional $57,742 |
| Immigrants | Israel | 100.0 /100 | #7 | Exceptional $57,384 |
| Immigrants | Hong Kong | 100.0 /100 | #8 | Exceptional $56,709 |
| Immigrants | Ireland | 100.0 /100 | #9 | Exceptional $56,584 |
| Okinawans | 100.0 /100 | #10 | Exceptional $55,817 |
| Eastern Europeans | 100.0 /100 | #11 | Exceptional $55,780 |
| Immigrants | Sweden | 100.0 /100 | #12 | Exceptional $55,582 |
| Immigrants | India | 100.0 /100 | #13 | Exceptional $55,268 |
| Immigrants | Belgium | 100.0 /100 | #14 | Exceptional $55,082 |
| Cypriots | 100.0 /100 | #15 | Exceptional $54,899 |
| Immigrants | Switzerland | 100.0 /100 | #16 | Exceptional $54,866 |
| Immigrants | France | 100.0 /100 | #17 | Exceptional $54,557 |
| Thais | 100.0 /100 | #18 | Exceptional $54,307 |
| Immigrants | China | 100.0 /100 | #19 | Exceptional $54,264 |
| Soviet Union | 100.0 /100 | #20 | Exceptional $54,202 |