Okinawan vs Immigrants from Taiwan No Schooling Completed
COMPARE
Okinawan
Immigrants from Taiwan
No Schooling Completed
No Schooling Completed Comparison
Okinawans
Immigrants from Taiwan
1.8%
NO SCHOOLING COMPLETED
97.1/ 100
METRIC RATING
108th/ 347
METRIC RANK
2.1%
NO SCHOOLING COMPLETED
42.6/ 100
METRIC RATING
181st/ 347
METRIC RANK
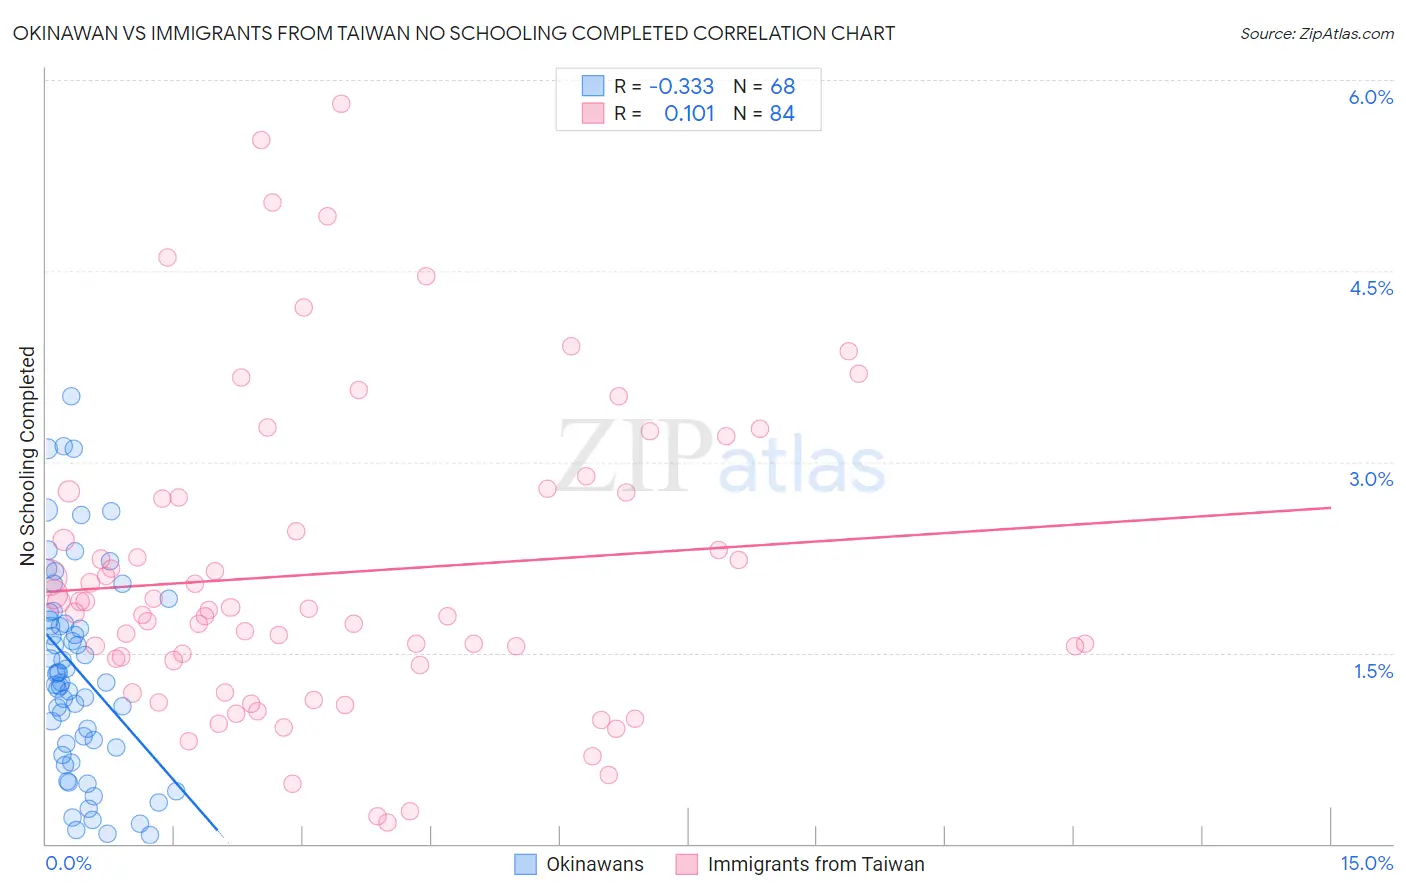
Okinawan vs Immigrants from Taiwan No Schooling Completed Correlation Chart
The statistical analysis conducted on geographies consisting of 73,597,304 people shows a mild negative correlation between the proportion of Okinawans and percentage of population with no schooling in the United States with a correlation coefficient (R) of -0.333 and weighted average of 1.8%. Similarly, the statistical analysis conducted on geographies consisting of 295,749,298 people shows a poor positive correlation between the proportion of Immigrants from Taiwan and percentage of population with no schooling in the United States with a correlation coefficient (R) of 0.101 and weighted average of 2.1%, a difference of 14.4%.
No Schooling Completed Correlation Summary
| Measurement | Okinawan | Immigrants from Taiwan |
| Minimum | 0.067% | 0.16% |
| Maximum | 3.5% | 5.8% |
| Range | 3.5% | 5.7% |
| Mean | 1.4% | 2.1% |
| Median | 1.3% | 1.8% |
| Interquartile 25% (IQ1) | 0.77% | 1.4% |
| Interquartile 75% (IQ3) | 1.8% | 2.7% |
| Interquartile Range (IQR) | 1.0% | 1.3% |
| Standard Deviation (Sample) | 0.81% | 1.2% |
| Standard Deviation (Population) | 0.80% | 1.2% |
Similar Demographics by No Schooling Completed
Demographics Similar to Okinawans by No Schooling Completed
In terms of no schooling completed, the demographic groups most similar to Okinawans are Yugoslavian (1.8%, a difference of 0.22%), Immigrants from France (1.8%, a difference of 0.26%), Immigrants from Saudi Arabia (1.9%, a difference of 0.35%), Immigrants from Latvia (1.9%, a difference of 0.48%), and Immigrants from Japan (1.9%, a difference of 0.63%).
| Demographics | Rating | Rank | No Schooling Completed |
| Immigrants | Czechoslovakia | 97.9 /100 | #101 | Exceptional 1.8% |
| Immigrants | Switzerland | 97.9 /100 | #102 | Exceptional 1.8% |
| Basques | 97.9 /100 | #103 | Exceptional 1.8% |
| Thais | 97.5 /100 | #104 | Exceptional 1.8% |
| German Russians | 97.5 /100 | #105 | Exceptional 1.8% |
| Immigrants | France | 97.3 /100 | #106 | Exceptional 1.8% |
| Yugoslavians | 97.2 /100 | #107 | Exceptional 1.8% |
| Okinawans | 97.1 /100 | #108 | Exceptional 1.8% |
| Immigrants | Saudi Arabia | 96.8 /100 | #109 | Exceptional 1.9% |
| Immigrants | Latvia | 96.7 /100 | #110 | Exceptional 1.9% |
| Immigrants | Japan | 96.6 /100 | #111 | Exceptional 1.9% |
| Pueblo | 96.4 /100 | #112 | Exceptional 1.9% |
| Immigrants | Zimbabwe | 96.2 /100 | #113 | Exceptional 1.9% |
| Immigrants | Norway | 96.1 /100 | #114 | Exceptional 1.9% |
| Syrians | 96.0 /100 | #115 | Exceptional 1.9% |
Demographics Similar to Immigrants from Taiwan by No Schooling Completed
In terms of no schooling completed, the demographic groups most similar to Immigrants from Taiwan are French American Indian (2.1%, a difference of 0.050%), Black/African American (2.1%, a difference of 0.15%), Pima (2.1%, a difference of 0.17%), Portuguese (2.1%, a difference of 0.18%), and Immigrants from Kazakhstan (2.1%, a difference of 0.24%).
| Demographics | Rating | Rank | No Schooling Completed |
| Immigrants | Micronesia | 50.0 /100 | #174 | Average 2.1% |
| Arabs | 46.4 /100 | #175 | Average 2.1% |
| Panamanians | 45.2 /100 | #176 | Average 2.1% |
| Arapaho | 45.0 /100 | #177 | Average 2.1% |
| Pakistanis | 44.7 /100 | #178 | Average 2.1% |
| Immigrants | Kazakhstan | 44.3 /100 | #179 | Average 2.1% |
| Portuguese | 43.9 /100 | #180 | Average 2.1% |
| Immigrants | Taiwan | 42.6 /100 | #181 | Average 2.1% |
| French American Indians | 42.2 /100 | #182 | Average 2.1% |
| Blacks/African Americans | 41.4 /100 | #183 | Average 2.1% |
| Pima | 41.3 /100 | #184 | Average 2.1% |
| Mongolians | 40.8 /100 | #185 | Average 2.1% |
| Immigrants | Bosnia and Herzegovina | 38.6 /100 | #186 | Fair 2.1% |
| Navajo | 36.5 /100 | #187 | Fair 2.1% |
| Immigrants | Kenya | 36.2 /100 | #188 | Fair 2.1% |