Cypriot vs Immigrants from Guatemala GED/Equivalency
COMPARE
Cypriot
Immigrants from Guatemala
GED/Equivalency
GED/Equivalency Comparison
Cypriots
Immigrants from Guatemala
88.9%
GED/EQUIVALENCY
99.9/ 100
METRIC RATING
14th/ 347
METRIC RANK
77.9%
GED/EQUIVALENCY
0.0/ 100
METRIC RATING
338th/ 347
METRIC RANK
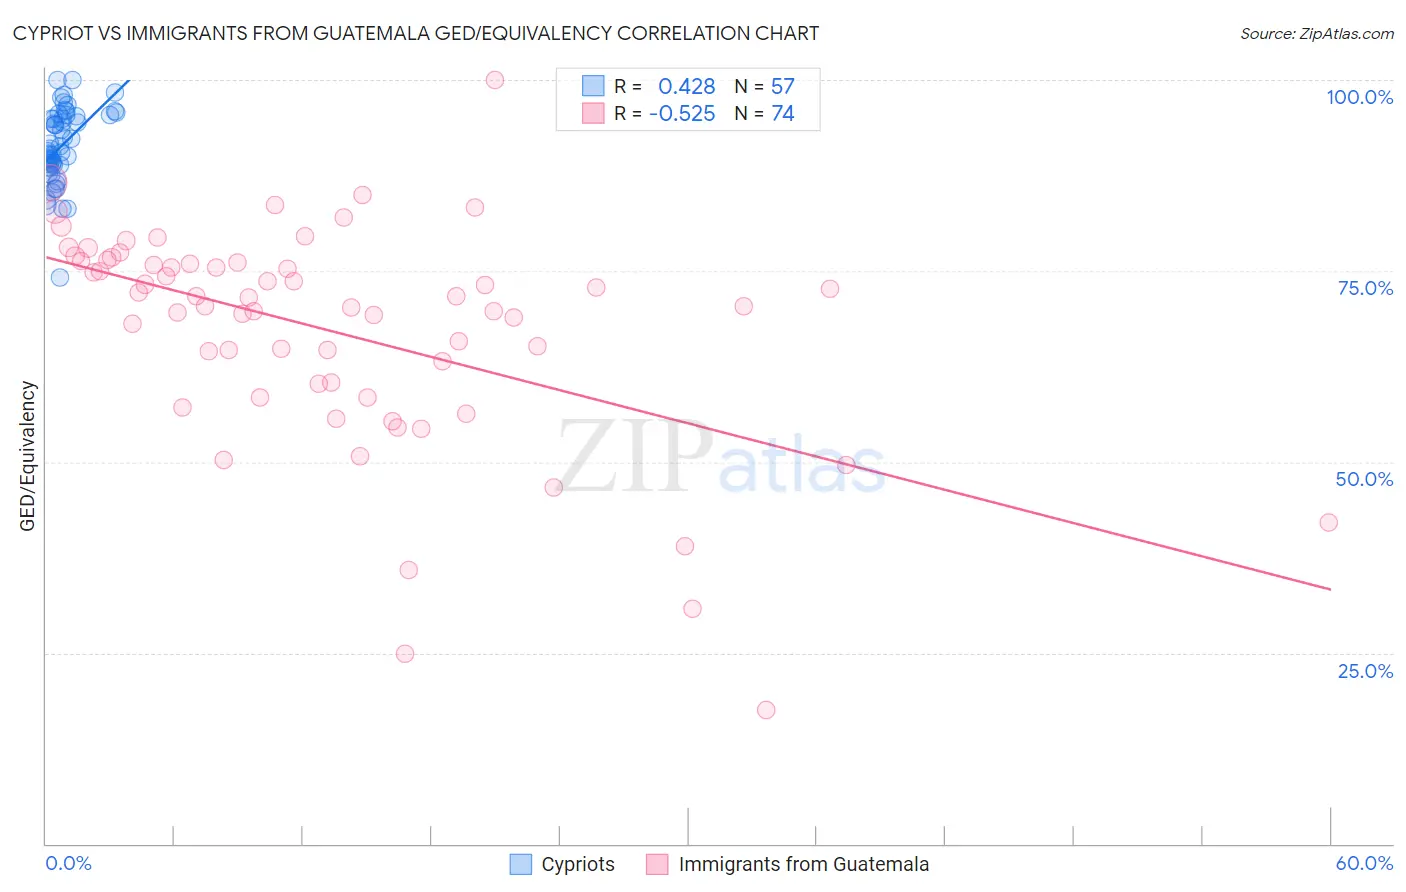
Cypriot vs Immigrants from Guatemala GED/Equivalency Correlation Chart
The statistical analysis conducted on geographies consisting of 61,870,289 people shows a moderate positive correlation between the proportion of Cypriots and percentage of population with at least ged/equivalency education in the United States with a correlation coefficient (R) of 0.428 and weighted average of 88.9%. Similarly, the statistical analysis conducted on geographies consisting of 377,286,142 people shows a substantial negative correlation between the proportion of Immigrants from Guatemala and percentage of population with at least ged/equivalency education in the United States with a correlation coefficient (R) of -0.525 and weighted average of 77.9%, a difference of 14.1%.
GED/Equivalency Correlation Summary
| Measurement | Cypriot | Immigrants from Guatemala |
| Minimum | 74.1% | 17.4% |
| Maximum | 100.0% | 100.0% |
| Range | 25.9% | 82.6% |
| Mean | 91.4% | 67.2% |
| Median | 90.9% | 71.0% |
| Interquartile 25% (IQ1) | 88.7% | 60.2% |
| Interquartile 75% (IQ3) | 95.3% | 76.1% |
| Interquartile Range (IQR) | 6.6% | 15.9% |
| Standard Deviation (Sample) | 4.9% | 14.6% |
| Standard Deviation (Population) | 4.9% | 14.5% |
Similar Demographics by GED/Equivalency
Demographics Similar to Cypriots by GED/Equivalency
In terms of ged/equivalency, the demographic groups most similar to Cypriots are Okinawan (88.9%, a difference of 0.020%), Immigrants from Iran (88.9%, a difference of 0.030%), Lithuanian (88.9%, a difference of 0.040%), Immigrants from Taiwan (88.8%, a difference of 0.050%), and Bulgarian (89.0%, a difference of 0.080%).
| Demographics | Rating | Rank | GED/Equivalency |
| Eastern Europeans | 99.9 /100 | #7 | Exceptional 89.1% |
| Carpatho Rusyns | 99.9 /100 | #8 | Exceptional 89.1% |
| Chinese | 99.9 /100 | #9 | Exceptional 89.0% |
| Norwegians | 99.9 /100 | #10 | Exceptional 89.0% |
| Bulgarians | 99.9 /100 | #11 | Exceptional 89.0% |
| Lithuanians | 99.9 /100 | #12 | Exceptional 88.9% |
| Immigrants | Iran | 99.9 /100 | #13 | Exceptional 88.9% |
| Cypriots | 99.9 /100 | #14 | Exceptional 88.9% |
| Okinawans | 99.9 /100 | #15 | Exceptional 88.9% |
| Immigrants | Taiwan | 99.9 /100 | #16 | Exceptional 88.8% |
| Croatians | 99.9 /100 | #17 | Exceptional 88.8% |
| Slovenes | 99.9 /100 | #18 | Exceptional 88.8% |
| Swedes | 99.9 /100 | #19 | Exceptional 88.8% |
| Maltese | 99.9 /100 | #20 | Exceptional 88.6% |
| Luxembourgers | 99.8 /100 | #21 | Exceptional 88.6% |
Demographics Similar to Immigrants from Guatemala by GED/Equivalency
In terms of ged/equivalency, the demographic groups most similar to Immigrants from Guatemala are Immigrants from Yemen (77.9%, a difference of 0.020%), Immigrants from Dominican Republic (78.0%, a difference of 0.090%), Immigrants from El Salvador (77.6%, a difference of 0.38%), Tohono O'odham (77.5%, a difference of 0.54%), and Mexican (77.4%, a difference of 0.63%).
| Demographics | Rating | Rank | GED/Equivalency |
| Immigrants | Honduras | 0.0 /100 | #331 | Tragic 78.7% |
| Immigrants | Azores | 0.0 /100 | #332 | Tragic 78.7% |
| Salvadorans | 0.0 /100 | #333 | Tragic 78.6% |
| Guatemalans | 0.0 /100 | #334 | Tragic 78.5% |
| Immigrants | Latin America | 0.0 /100 | #335 | Tragic 78.5% |
| Immigrants | Dominican Republic | 0.0 /100 | #336 | Tragic 78.0% |
| Immigrants | Yemen | 0.0 /100 | #337 | Tragic 77.9% |
| Immigrants | Guatemala | 0.0 /100 | #338 | Tragic 77.9% |
| Immigrants | El Salvador | 0.0 /100 | #339 | Tragic 77.6% |
| Tohono O'odham | 0.0 /100 | #340 | Tragic 77.5% |
| Mexicans | 0.0 /100 | #341 | Tragic 77.4% |
| Pima | 0.0 /100 | #342 | Tragic 76.4% |
| Immigrants | Central America | 0.0 /100 | #343 | Tragic 76.4% |
| Spanish American Indians | 0.0 /100 | #344 | Tragic 76.3% |
| Immigrants | Mexico | 0.0 /100 | #345 | Tragic 75.7% |