Cypriot vs Immigrants Per Capita Income
COMPARE
Cypriot
Immigrants
Per Capita Income
Per Capita Income Comparison
Cypriots
Immigrants
$54,899
PER CAPITA INCOME
100.0/ 100
METRIC RATING
15th/ 347
METRIC RANK
$43,010
PER CAPITA INCOME
32.5/ 100
METRIC RATING
185th/ 347
METRIC RANK
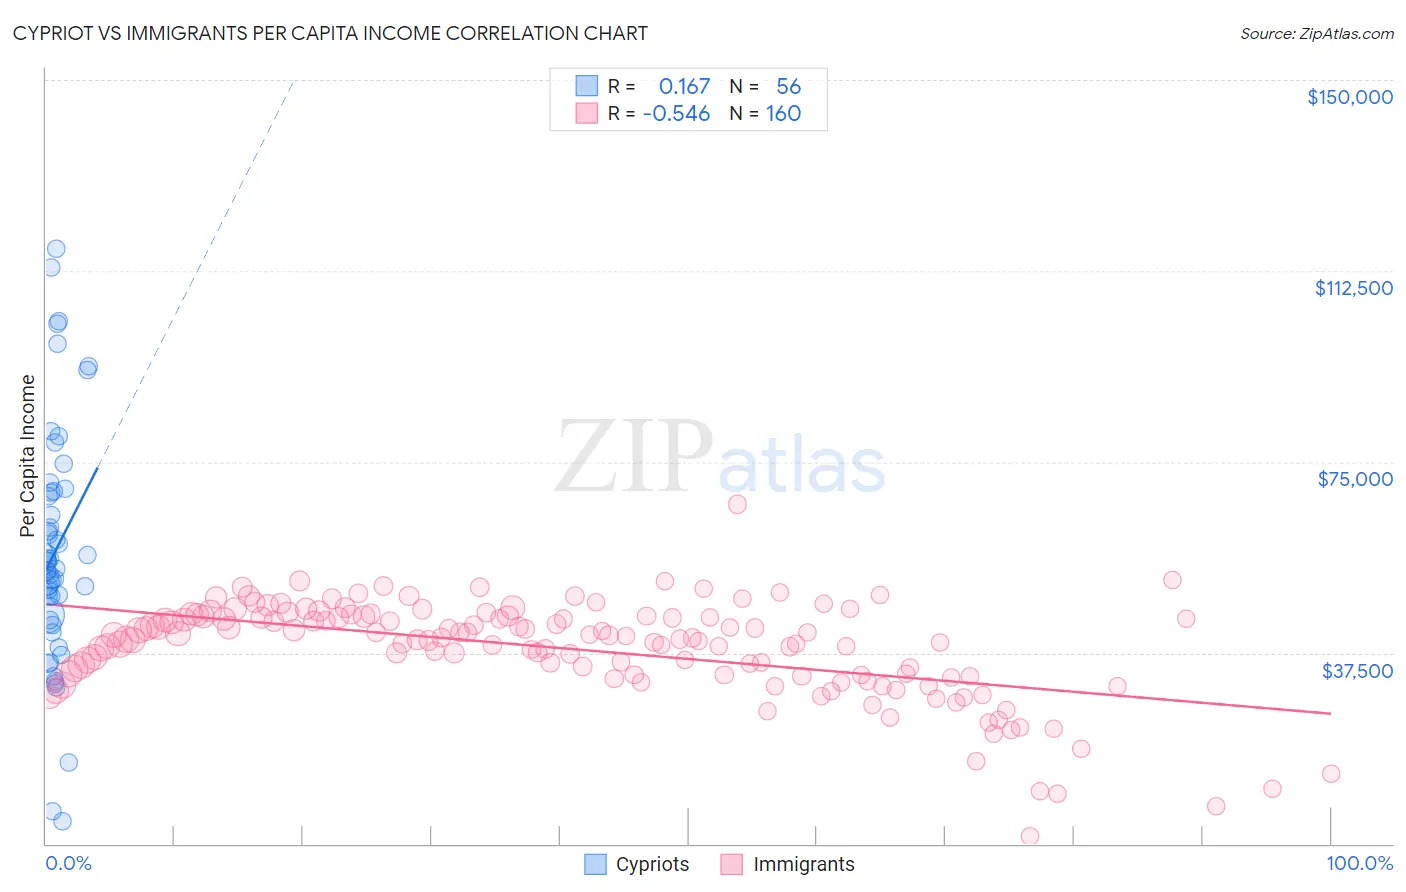
Cypriot vs Immigrants Per Capita Income Correlation Chart
The statistical analysis conducted on geographies consisting of 61,866,365 people shows a poor positive correlation between the proportion of Cypriots and per capita income in the United States with a correlation coefficient (R) of 0.167 and weighted average of $54,899. Similarly, the statistical analysis conducted on geographies consisting of 577,833,144 people shows a substantial negative correlation between the proportion of Immigrants and per capita income in the United States with a correlation coefficient (R) of -0.546 and weighted average of $43,010, a difference of 27.6%.
Per Capita Income Correlation Summary
| Measurement | Cypriot | Immigrants |
| Minimum | $4,509 | $1,397 |
| Maximum | $116,766 | $66,654 |
| Range | $112,257 | $65,257 |
| Mean | $57,593 | $38,278 |
| Median | $54,638 | $40,300 |
| Interquartile 25% (IQ1) | $44,518 | $33,050 |
| Interquartile 75% (IQ3) | $69,117 | $44,506 |
| Interquartile Range (IQR) | $24,599 | $11,456 |
| Standard Deviation (Sample) | $23,513 | $9,625 |
| Standard Deviation (Population) | $23,302 | $9,595 |
Similar Demographics by Per Capita Income
Demographics Similar to Cypriots by Per Capita Income
In terms of per capita income, the demographic groups most similar to Cypriots are Immigrants from Switzerland ($54,866, a difference of 0.060%), Immigrants from Belgium ($55,082, a difference of 0.33%), Immigrants from France ($54,557, a difference of 0.63%), Immigrants from India ($55,268, a difference of 0.67%), and Thai ($54,307, a difference of 1.1%).
| Demographics | Rating | Rank | Per Capita Income |
| Immigrants | Hong Kong | 100.0 /100 | #8 | Exceptional $56,709 |
| Immigrants | Ireland | 100.0 /100 | #9 | Exceptional $56,584 |
| Okinawans | 100.0 /100 | #10 | Exceptional $55,817 |
| Eastern Europeans | 100.0 /100 | #11 | Exceptional $55,780 |
| Immigrants | Sweden | 100.0 /100 | #12 | Exceptional $55,582 |
| Immigrants | India | 100.0 /100 | #13 | Exceptional $55,268 |
| Immigrants | Belgium | 100.0 /100 | #14 | Exceptional $55,082 |
| Cypriots | 100.0 /100 | #15 | Exceptional $54,899 |
| Immigrants | Switzerland | 100.0 /100 | #16 | Exceptional $54,866 |
| Immigrants | France | 100.0 /100 | #17 | Exceptional $54,557 |
| Thais | 100.0 /100 | #18 | Exceptional $54,307 |
| Immigrants | China | 100.0 /100 | #19 | Exceptional $54,264 |
| Soviet Union | 100.0 /100 | #20 | Exceptional $54,202 |
| Immigrants | Northern Europe | 100.0 /100 | #21 | Exceptional $54,159 |
| Indians (Asian) | 100.0 /100 | #22 | Exceptional $53,874 |
Demographics Similar to Immigrants by Per Capita Income
In terms of per capita income, the demographic groups most similar to Immigrants are French Canadian ($43,003, a difference of 0.020%), Spaniard ($43,028, a difference of 0.040%), Immigrants from Colombia ($42,971, a difference of 0.090%), German ($43,067, a difference of 0.13%), and Immigrants from Africa ($42,950, a difference of 0.14%).
| Demographics | Rating | Rank | Per Capita Income |
| Immigrants | Costa Rica | 44.5 /100 | #178 | Average $43,464 |
| Finns | 44.4 /100 | #179 | Average $43,461 |
| Sierra Leoneans | 42.9 /100 | #180 | Average $43,405 |
| Welsh | 38.2 /100 | #181 | Fair $43,233 |
| Immigrants | Vietnam | 38.1 /100 | #182 | Fair $43,229 |
| Germans | 33.9 /100 | #183 | Fair $43,067 |
| Spaniards | 32.9 /100 | #184 | Fair $43,028 |
| Immigrants | Immigrants | 32.5 /100 | #185 | Fair $43,010 |
| French Canadians | 32.3 /100 | #186 | Fair $43,003 |
| Immigrants | Colombia | 31.5 /100 | #187 | Fair $42,971 |
| Immigrants | Africa | 31.0 /100 | #188 | Fair $42,950 |
| Bermudans | 30.1 /100 | #189 | Fair $42,911 |
| Kenyans | 27.7 /100 | #190 | Fair $42,808 |
| Yugoslavians | 27.4 /100 | #191 | Fair $42,792 |
| Iraqis | 26.7 /100 | #192 | Fair $42,760 |