Cypriot vs Immigrants Cognitive Disability
COMPARE
Cypriot
Immigrants
Cognitive Disability
Cognitive Disability Comparison
Cypriots
Immigrants
17.1%
COGNITIVE DISABILITY
85.7/ 100
METRIC RATING
149th/ 347
METRIC RANK
17.2%
COGNITIVE DISABILITY
62.5/ 100
METRIC RATING
168th/ 347
METRIC RANK
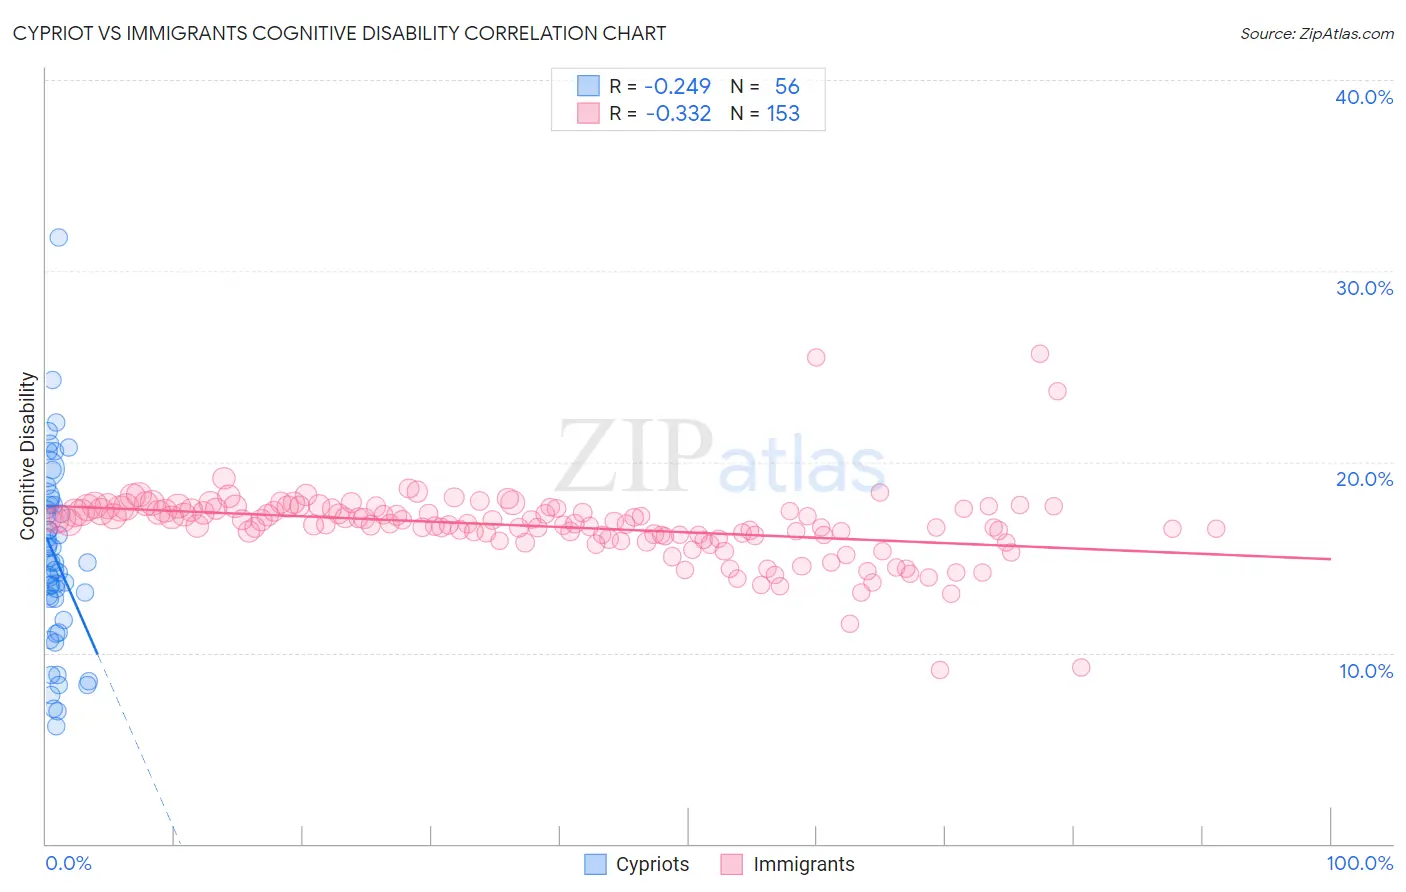
Cypriot vs Immigrants Cognitive Disability Correlation Chart
The statistical analysis conducted on geographies consisting of 61,869,277 people shows a weak negative correlation between the proportion of Cypriots and percentage of population with cognitive disability in the United States with a correlation coefficient (R) of -0.249 and weighted average of 17.1%. Similarly, the statistical analysis conducted on geographies consisting of 577,580,100 people shows a mild negative correlation between the proportion of Immigrants and percentage of population with cognitive disability in the United States with a correlation coefficient (R) of -0.332 and weighted average of 17.2%, a difference of 0.92%.
Cognitive Disability Correlation Summary
| Measurement | Cypriot | Immigrants |
| Minimum | 6.1% | 9.1% |
| Maximum | 31.8% | 25.7% |
| Range | 25.6% | 16.6% |
| Mean | 14.9% | 16.6% |
| Median | 14.7% | 16.8% |
| Interquartile 25% (IQ1) | 12.3% | 16.0% |
| Interquartile 75% (IQ3) | 17.7% | 17.6% |
| Interquartile Range (IQR) | 5.5% | 1.5% |
| Standard Deviation (Sample) | 4.8% | 1.9% |
| Standard Deviation (Population) | 4.8% | 1.9% |
Demographics Similar to Cypriots and Immigrants by Cognitive Disability
In terms of cognitive disability, the demographic groups most similar to Cypriots are French Canadian (17.1%, a difference of 0.0%), Basque (17.1%, a difference of 0.010%), Syrian (17.1%, a difference of 0.15%), Immigrants from Indonesia (17.1%, a difference of 0.16%), and Immigrants from Kazakhstan (17.1%, a difference of 0.27%). Similarly, the demographic groups most similar to Immigrants are Immigrants from Syria (17.2%, a difference of 0.030%), Immigrants from Ecuador (17.2%, a difference of 0.060%), Immigrants from Albania (17.2%, a difference of 0.070%), Armenian (17.2%, a difference of 0.24%), and Yugoslavian (17.2%, a difference of 0.29%).
| Demographics | Rating | Rank | Cognitive Disability |
| French Canadians | 85.7 /100 | #148 | Excellent 17.1% |
| Cypriots | 85.7 /100 | #149 | Excellent 17.1% |
| Basques | 85.5 /100 | #150 | Excellent 17.1% |
| Syrians | 83.0 /100 | #151 | Excellent 17.1% |
| Immigrants | Indonesia | 82.7 /100 | #152 | Excellent 17.1% |
| Immigrants | Kazakhstan | 80.5 /100 | #153 | Excellent 17.1% |
| Immigrants | Malaysia | 79.3 /100 | #154 | Good 17.1% |
| Brazilians | 78.9 /100 | #155 | Good 17.1% |
| Sri Lankans | 78.9 /100 | #156 | Good 17.1% |
| Immigrants | Australia | 76.0 /100 | #157 | Good 17.1% |
| Celtics | 74.1 /100 | #158 | Good 17.1% |
| Immigrants | Latvia | 73.2 /100 | #159 | Good 17.2% |
| Australians | 72.4 /100 | #160 | Good 17.2% |
| Americans | 72.2 /100 | #161 | Good 17.2% |
| Yugoslavians | 71.6 /100 | #162 | Good 17.2% |
| Immigrants | Switzerland | 71.5 /100 | #163 | Good 17.2% |
| Armenians | 70.1 /100 | #164 | Good 17.2% |
| Immigrants | Albania | 64.9 /100 | #165 | Good 17.2% |
| Immigrants | Ecuador | 64.4 /100 | #166 | Good 17.2% |
| Immigrants | Syria | 63.5 /100 | #167 | Good 17.2% |
| Immigrants | Immigrants | 62.5 /100 | #168 | Good 17.2% |