Crow vs Immigrants from Hong Kong Associate's Degree
COMPARE
Crow
Immigrants from Hong Kong
Associate's Degree
Associate's Degree Comparison
Crow
Immigrants from Hong Kong
37.6%
ASSOCIATE'S DEGREE
0.0/ 100
METRIC RATING
316th/ 347
METRIC RANK
55.4%
ASSOCIATE'S DEGREE
100.0/ 100
METRIC RATING
14th/ 347
METRIC RANK
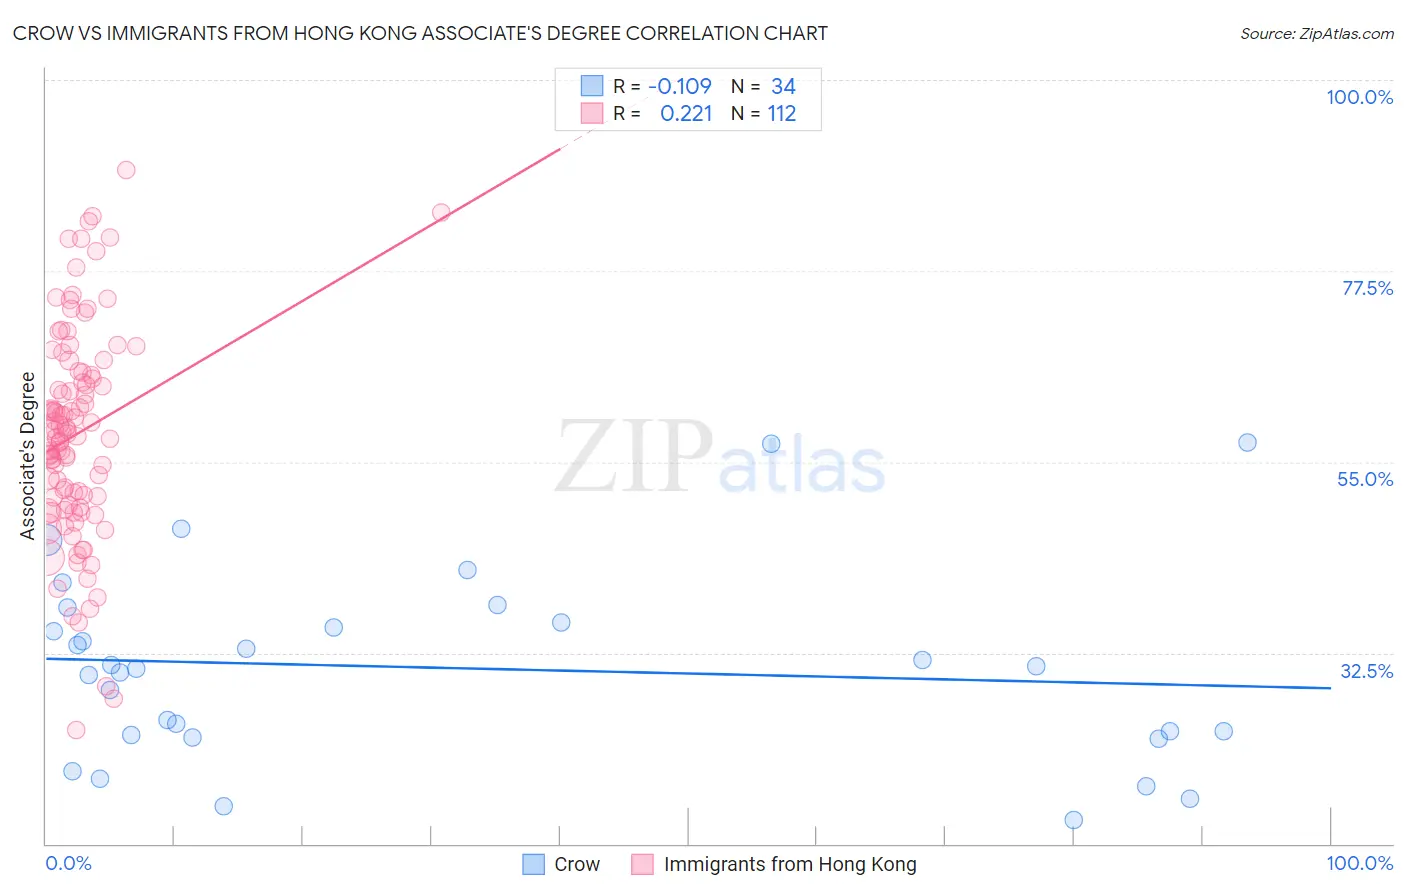
Crow vs Immigrants from Hong Kong Associate's Degree Correlation Chart
The statistical analysis conducted on geographies consisting of 59,209,492 people shows a poor negative correlation between the proportion of Crow and percentage of population with at least associate's degree education in the United States with a correlation coefficient (R) of -0.109 and weighted average of 37.6%. Similarly, the statistical analysis conducted on geographies consisting of 253,990,250 people shows a weak positive correlation between the proportion of Immigrants from Hong Kong and percentage of population with at least associate's degree education in the United States with a correlation coefficient (R) of 0.221 and weighted average of 55.4%, a difference of 47.5%.
Associate's Degree Correlation Summary
| Measurement | Crow | Immigrants from Hong Kong |
| Minimum | 12.8% | 23.3% |
| Maximum | 57.2% | 89.4% |
| Range | 44.4% | 66.0% |
| Mean | 30.7% | 58.3% |
| Median | 30.8% | 58.4% |
| Interquartile 25% (IQ1) | 22.8% | 50.4% |
| Interquartile 75% (IQ3) | 36.1% | 65.4% |
| Interquartile Range (IQR) | 13.3% | 15.1% |
| Standard Deviation (Sample) | 11.1% | 12.4% |
| Standard Deviation (Population) | 10.9% | 12.4% |
Similar Demographics by Associate's Degree
Demographics Similar to Crow by Associate's Degree
In terms of associate's degree, the demographic groups most similar to Crow are Creek (37.6%, a difference of 0.010%), Yaqui (37.6%, a difference of 0.020%), Alaska Native (37.5%, a difference of 0.25%), Seminole (37.7%, a difference of 0.40%), and Hispanic or Latino (37.7%, a difference of 0.45%).
| Demographics | Rating | Rank | Associate's Degree |
| Immigrants | Guatemala | 0.0 /100 | #309 | Tragic 38.1% |
| Immigrants | Dominican Republic | 0.0 /100 | #310 | Tragic 37.9% |
| Immigrants | Latin America | 0.0 /100 | #311 | Tragic 37.9% |
| Choctaw | 0.0 /100 | #312 | Tragic 37.8% |
| Hispanics or Latinos | 0.0 /100 | #313 | Tragic 37.7% |
| Seminole | 0.0 /100 | #314 | Tragic 37.7% |
| Creek | 0.0 /100 | #315 | Tragic 37.6% |
| Crow | 0.0 /100 | #316 | Tragic 37.6% |
| Yaqui | 0.0 /100 | #317 | Tragic 37.6% |
| Alaska Natives | 0.0 /100 | #318 | Tragic 37.5% |
| Fijians | 0.0 /100 | #319 | Tragic 37.4% |
| Cajuns | 0.0 /100 | #320 | Tragic 37.4% |
| Immigrants | Yemen | 0.0 /100 | #321 | Tragic 37.3% |
| Pennsylvania Germans | 0.0 /100 | #322 | Tragic 37.2% |
| Immigrants | Cabo Verde | 0.0 /100 | #323 | Tragic 36.8% |
Demographics Similar to Immigrants from Hong Kong by Associate's Degree
In terms of associate's degree, the demographic groups most similar to Immigrants from Hong Kong are Immigrants from Eastern Asia (55.4%, a difference of 0.030%), Immigrants from China (55.5%, a difference of 0.14%), Soviet Union (55.1%, a difference of 0.50%), Immigrants from South Central Asia (55.7%, a difference of 0.63%), and Eastern European (55.0%, a difference of 0.64%).
| Demographics | Rating | Rank | Associate's Degree |
| Immigrants | Iran | 100.0 /100 | #7 | Exceptional 57.7% |
| Thais | 100.0 /100 | #8 | Exceptional 57.4% |
| Immigrants | Israel | 100.0 /100 | #9 | Exceptional 56.8% |
| Cypriots | 100.0 /100 | #10 | Exceptional 56.4% |
| Immigrants | Australia | 100.0 /100 | #11 | Exceptional 55.8% |
| Immigrants | South Central Asia | 100.0 /100 | #12 | Exceptional 55.7% |
| Immigrants | China | 100.0 /100 | #13 | Exceptional 55.5% |
| Immigrants | Hong Kong | 100.0 /100 | #14 | Exceptional 55.4% |
| Immigrants | Eastern Asia | 100.0 /100 | #15 | Exceptional 55.4% |
| Soviet Union | 100.0 /100 | #16 | Exceptional 55.1% |
| Eastern Europeans | 100.0 /100 | #17 | Exceptional 55.0% |
| Indians (Asian) | 100.0 /100 | #18 | Exceptional 54.8% |
| Immigrants | Ireland | 100.0 /100 | #19 | Exceptional 54.7% |
| Cambodians | 100.0 /100 | #20 | Exceptional 54.6% |
| Immigrants | Sweden | 100.0 /100 | #21 | Exceptional 54.6% |